
Electrical and Electronic Equipment (EEE) is increasingly in demand in today’s society, driven by higher levels of disposable income, increasing urbanization and industrialization, and population growth.
A large proportion of EEE has a short life span, and is often perceived as being difficult or expensive to repair. Brands spend billions creating consumer demand for the latest models, leaving older technology obsolete and unwanted even when it remains serviceable.
After its use, EEE is disposed of and becomes Electronic Waste, often shortened to e-waste.
E-Waste contains a mixture of valuable materials that can be recycled (but which usually aren’t), and toxic materials such as lead, mercury and cadmium which can be hazardous to our health and to the environment.
In this article, I will reveal the latest research, facts, and statistics which illustrate the scale and consequences of the global e-waste problem.
Contents
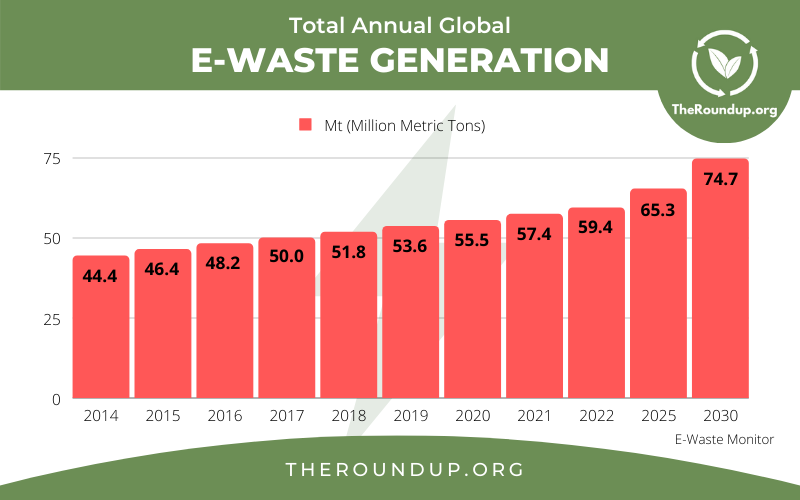
It is estimated that 57.4 Mt (Million Metric Tonnes) of e-waste was generated globally in 2021.
There has been an increase year on year since e-waste data started being collected in 2014.
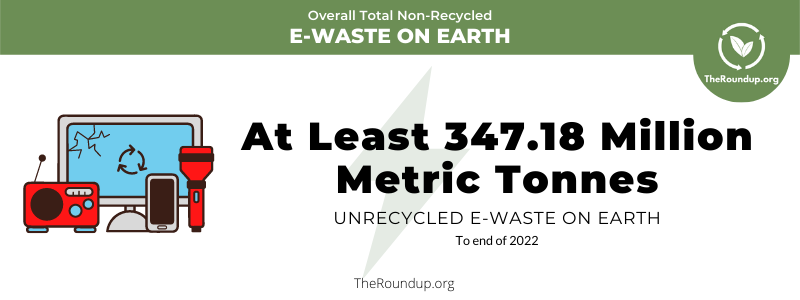
There is no official figure for the total amount of unrecycled e-waste currently on Earth. However, using the latest data that we do have, it is possible to make an estimate.
We know that since data was first collected in 2014, up until the end of 2022 there will have been an estimated total of 420.3 Million Metric Tonnes of e-waste produced. We also know that on average, only a small percentage of that is recycled (see below for recycling data).
Based on this we can estimate that at least 347 Mt of e-waste remains.
This is likely to be a conservative estimate for the following reasons:
On average, the global e-waste generation has increased by 2 Mt annually over the last decade.
Global electronic waste volume is projected to grow to 74.7 Mt by 2030 – meaning it will have almost doubled in only 16 years.
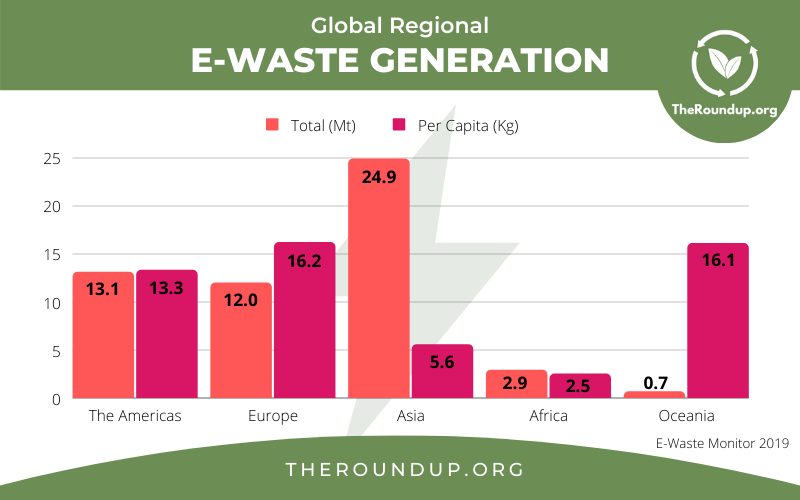
Asia (24.9 Mt), the Americas (13.1 Mt) and Europe (12Mt) produced the overwhelming majority of E-Waste when measured by total weight.
When measured per capita, Europeans (16.2 Kg) produce the most e-waste per person, followed by Oceania (16.1 Kg) and the Americas (13.3 Kg).
African residents produce the least amount of e-waste per capita.
China, the US, and India produce the most electronic waste.
The table below shows the top 10 e-waste producing countries in the world, in terms of the total volume produced (shown in KiloTons).
| Rank | Country | E-Waste Produced (Kt) | Recycling Rate |
|---|---|---|---|
| 1 | China | 10129 | 16% |
| 2 | USA | 6918 | 15% |
| 3 | India | 3230 | 1% |
| 4 | Japan | 2569 | 22% |
| 5 | Brazil | 2143 | 0% |
| 6 | Russia | 1631 | 6% |
| 7 | Indonesia | 1618 | n/a |
| 8 | Germany | 1607 | 52% |
| 9 | UK | 1598 | 57% |
| 10 | France | 1362 | 56% |
For each country in the top 10, you can also see their individual recycling rate, according to the latest available data (Updated June 2024).
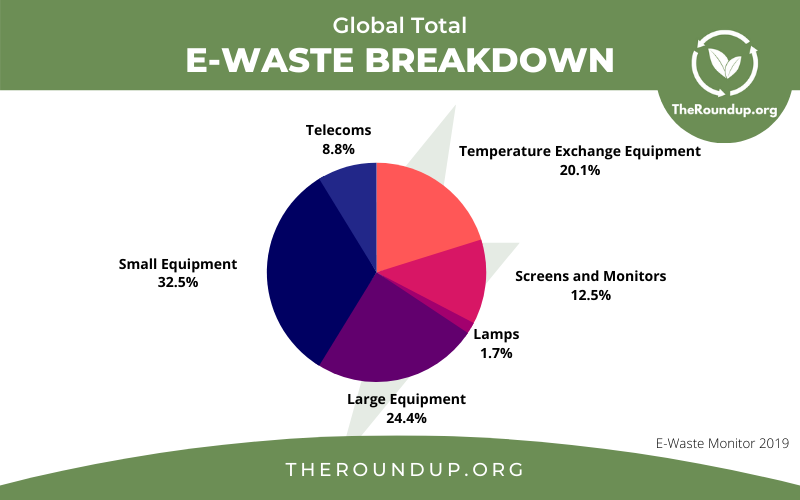
The 53.6 Mt is comprised of the following items:
Of these categories, screens and monitors is the only one whose production has decreased since 2014, and this is only because older, heavier monitors are no longer produced.
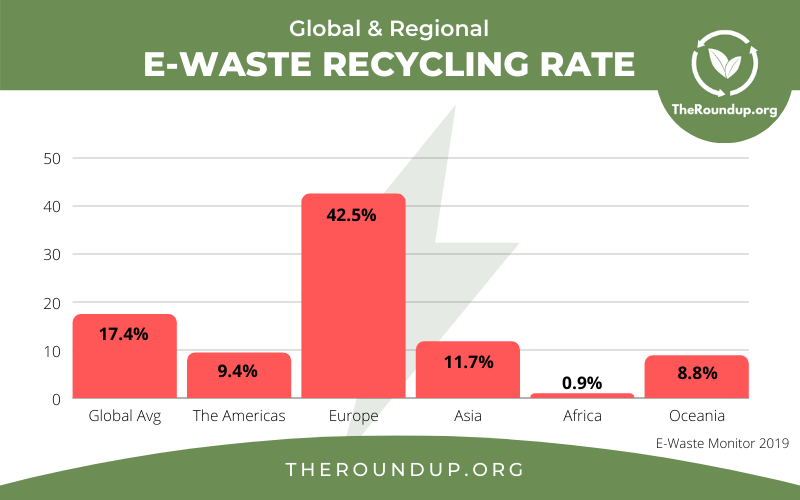
Less than 1/5 is recycled globally, although this varies by region.
Only 17.4% of total global e-waste is known to have been collected and properly recycled. This figure has fallen in the last 5 years as a percentage of total waste generated.
Europe has by far the highest collection and recycling rate at 42.5%. Asia, in second place, had a rate of just 11.7%. Africa has the lowest at just 0.9%.
Estonia, Norway, and Iceland have the best electronic waste recycling rates in terms of the percentage of waste that each country produces, according to the latest available data.
| Rank | Country | E-Waste Recycled (Kt) | Recycling Rate |
|---|---|---|---|
| 1 | Estonia | 13 | 76% |
| 2 | Norway | 99 | 72% |
| 3 | Iceland | 5 | 71% |
| 4 | Sweden | 141 | 70% |
| 5 | Austria | 116 | 69% |
| 6 | Switzerland | 123 | 63% |
| 7 | Finland | 65 | 61% |
| 8 | Poland | 246 | 60% |
| 9 | Ireland | 52 | 59% |
| 10 | UK | 871 | 57% |
The top 10 e-waste recycling countries are ranked by the percentage of their waste that is formally collected for proper recycling, while the total amount recycled (in KiloTons) is also shown for reference.
82.6% of electronic waste is not recycled (via official channels) and therefore not documented. Researchers cannot accurately track where it ends up.
It is estimated that 8% of e-waste is discarded in the trash, and subsequently goes to landfill or gets incinerated. This consists mostly of smaller electrical and It items (tablets, mobile phones etc).
Up to 20% is estimated to be exported, either as second hand products or as pure waste.
By the end of 2019, 78 countries had a national e-waste policy, legislation, or regulation. This covered some 71% of the world’s population, a significant increase from just 44% 5 years previously.
However, the enforcement of legislation in some countries is poor or even non existent.
Furthermore, there are still 25 US states, including Arizona, Colorado, Florida, Georgia, Massachusetts, and Nevada, that still do not have any legislation requiring e-waste to be recycled.
E-waste contains several scarce and valuable raw materials, most of which are currently not recaptured. That’s why the global e-waste management market is likely to grow, due to financial reasons as well as environmental ones.
The market was valued at $49,880 million in 2020, and it is projected to almost triple to $143,870 million by 2028.
Although its fate is unproven, estimates suggest that most undocumented electronic waste is mixed with other waste, such as plastic and metal. This means that easily recyclable parts might be recycled, but it will usually be done poorly.
No steps will be taken to remove toxic elements, and many more valuable reusable components might be missed. This is why e-waste must be recycled separately.
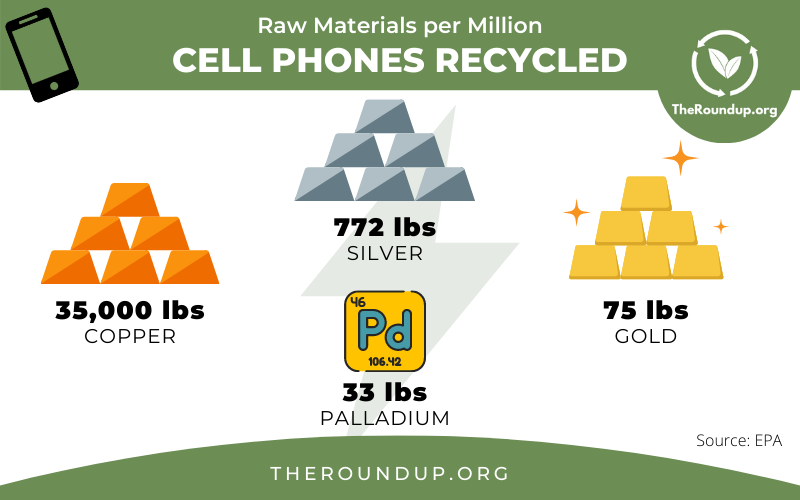
There are several high-value raw materials in e-waste, including gold, silver, copper, and iron.
Recycling just one million used cell phones can recover as much as 772lbs of silver, 35,000lbs of copper, 75lbs of gold, and 33lbs of palladium.
It is estimated that the 53.6 Mt of e-waste generated in 2019 contained raw materials worth around $57 billion.
Considering that 82.6% of electronic waste wasn’t recycled, that translates as nearly $47 billion worth of valuable metals that were never recovered.
E-waste does not biodegrade, and therefore will accumulate wherever it is dumped, in much the same way that plastic waste does.
Over time, any greenhouse gases contained within the e-waste will slowly be released into the atmosphere.
The toxic materials such as mercury and BFR plastics that are found in e-waste have a negative effect on the environment and health of people or animals that come into contact with it.
When disposed of improperly, these chemicals can be released indefinitely into the air, soil or water which is detrimental to ecosystems as well as human populations.
When e-waste materials are not recycled, new raw materials are required to create new EEE. Every electronic device manufactured has its own carbon footprint.
The extraction and refinement of materials required to produce EEE creates greenhouse gases. This could be reduced or avoided if e-waste was recycled.
Also, refrigerants used in temperature control EEE such as refrigerators or air conditioners are themselves greenhouse gases. In 2019, discarded fridges and air con units released CO2 equivalents that actually accounted for around 0.3% of total global energy-related emissions.
Electronic waste is an under-reported yet still very significant global issue. It wastes precious resources, contributes to climate change, and is hazardous to the environment and to human health.
Worst of all, it’s completely unnecessary. This is one issue that each of us can help to tackle at an individual level. If we make a conscious decision to live a more eco-friendly lifestyle, our choices can make a big difference.
In developed countries, we all have access to facilities that will recycle our used electronic equipment for us. The fact that so many people don’t do this is down to either a lack of education or sheer laziness.
We’ve seen that smaller items add up to the largest share of global e-waste. So make simple choices such as:
Be mindful of what you buy, how you use it, and how you dispose of it when it’s finally at the end of its lifespan.
Many items can be repaired rather than replaced, often much more cheaply than simply spending on a newer model.
Also consider that the less frequently and more carefully we use our electrical appliances, the longer they last.
E-waste is the one problem that we can do something about without relying on corporations or governments. So let’s all do our bit. Your children, and theirs, will thank you for it.
Geneva Environment Network | United Nations University | World Economic Forum | Allied Market Research | ERI Direct