
TheRoundup is reader-supported. We may earn a commission when you make a purchase via links on this site, at no cost to you.
All products are reviewed in accordance with our Review Methodology.
Greenhouse gases (GHGs) trap heat near Earth's surface, affecting the climate by increasing global temperatures. The effects of global warming are all around us, including more intense storms, frequent wildfires, and rising sea levels.
We all know the theory, but what about the facts? What drives these emissions, what harm do they do, and what can we do about them?
Our research reveals the key air pollution, carbon dioxide, other greenhouse gas emission, and climate change statistics both globally and in the United States.
Using the latest 2026 data sources, you will learn about the scale of the climate change problem, what causes it, and what (if anything) can be done to stop it.
Contents
Contrary to popular belief, not all GHGs are bad. They occur naturally, and if we didn’t have any GHGs in our atmosphere at all, then the Earth would become too cold and much of the life we know would be unable to survive.
Climate change is caused by an excess of greenhouse gases. When we have more GHGs in the atmosphere than the Earth can naturally absorb, they trap excess heat, and the global temperature increases.
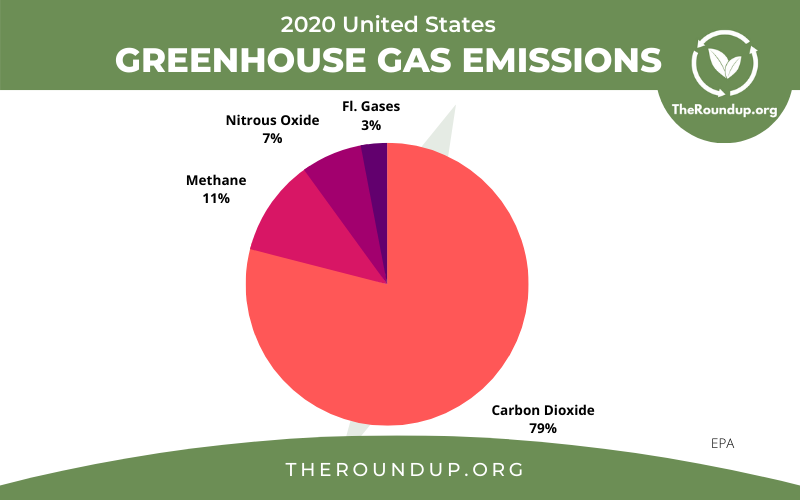
There are 5 main greenhouse gases (GHGs) that trap heat within the Earth’s atmosphere and cause global temperatures to get warmer. But only 4 are caused directly by humans (and therefore recorded on the pie chart above).

It is generally accepted that since around the year 1950, human activity has been producing more GHGs than the Earth can absorb, and this is when man-made climate change can be said to have started.
In 1950 there was 311.79 PPM of CO2 in the atmosphere. In 2021 that had risen to 416.45. So in 1950, there was only 74.86% as much CO2 in the atmosphere as we have currently.
Therefore to answer the question, we can assume that based on the latest figures, around 25% of the total CO2 in the atmosphere is contributing to climate change.
The single biggest contributor to man-made greenhouse gas emissions is burning fossil fuels - coal, oil, and natural gas.
The EPA estimates that carbon dioxide accounts for around 75% of GHG emissions caused by human activity, and fossil fuels are the primary cause of CO2.

We know that CO2 is the predominant greenhouse gas by volume produced, but does it actually have the biggest effect on climate change?
The answer is yes, based on current data, it does.
The Annual Greenhouse Gas Index (AGGI) is a way of measuring how much influence the different GHGs have on climate change. It uses a metric known as Global Radiative Forcing which essentially multiplies the amount of each GHG in the atmosphere by the effect per part that each gas has, in order to determine its overall contribution to global warming.
Based on the latest 2021 AGGI data, carbon dioxide is responsible for 2.14 of the total 3.222 Global Radiative Forcing, meaning that currently, CO2 causes 66% of global warming.
Methane does trap more heat than carbon dioxide when compared pound for pound, but there is a lot less of it, so the overall atmospheric burden of methane is less.
The IEA states that one tonne of methane is between 28-36 times as potent as a tonne of CO2 over a 100-year period, in terms of its ability to trap heat in the atmosphere.
According to the AGGI, methane currently accounts for 16% of global warming.
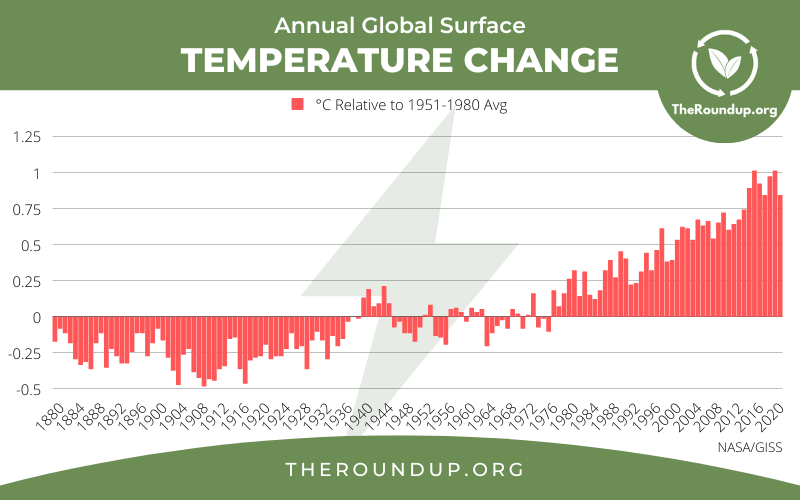
When we look at the graph showing average global surface temperature anomalies, we can see a clear trend showing that temperatures started to increase around the 1960s and this continues up to the present day, with the increases growing ever larger.
Scientists first began to notice a trend in rising sea temperatures starting from the 1950s (although it was some years later when the change became noticeable enough to distinguish it from natural temperature variations).
However, the causes of climate change can probably be traced back to the industrial revolution, sometime around the 1830s, when humans first began to burn large quantities of fossil fuels.
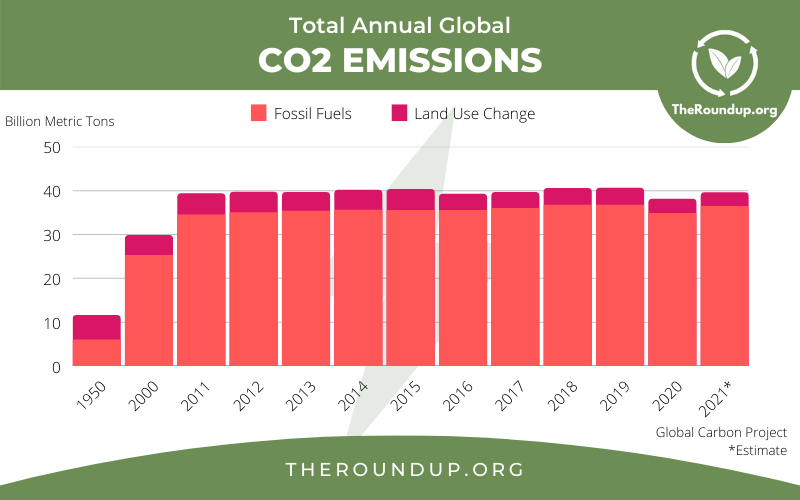
Global emissions amount to about 40.53 Billion Tons of Carbon Dioxide each year.
The figure is not going down but has remained broadly stable over the last decade.
Yes, carbon emissions did decrease slightly to 38.02 Billion Tons in 2020 compared to 40.53 billion tons in 2019.
This was largely due to reduced fossil fuel usage during the COVID19 pandemic.
However, estimates suggest that this will have rebounded to previous levels in 2021.
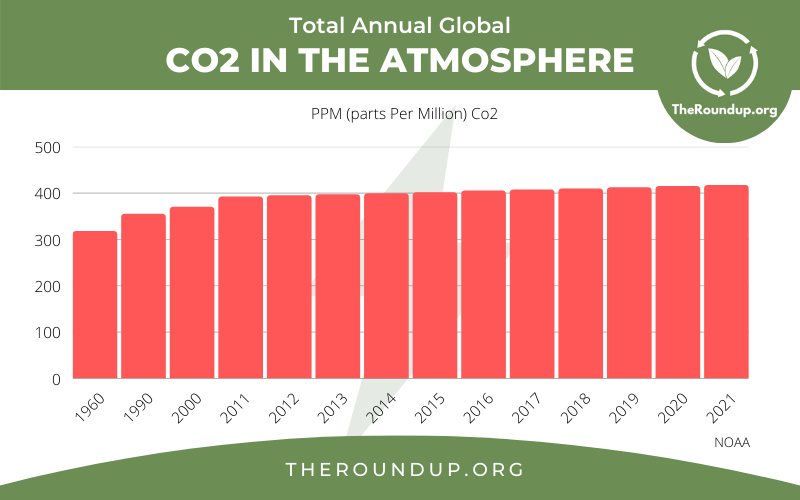
There were 416.45 parts per million of CO2 in the Earth’s atmosphere in 2021. This is an all-time high.
The amount of CO2 in the atmosphere has increased every year, year on year since the 1950s, meaning we continue to produce more carbon dioxide than the earth can absorb. This makes a major contribution towards heating the planet.
| Year | Global CO2 PPM |
|---|---|
| 2011 | 391.85 |
| 2012 | 394.06 |
| 2013 | 396.74 |
| 2014 | 398.81 |
| 2015 | 401.01 |
| 2016 | 404.41 |
| 2017 | 406.76 |
| 2018 | 408.72 |
| 2019 | 411.66 |
| 2020 | 414.24 |
| 2021 | 416.45 |
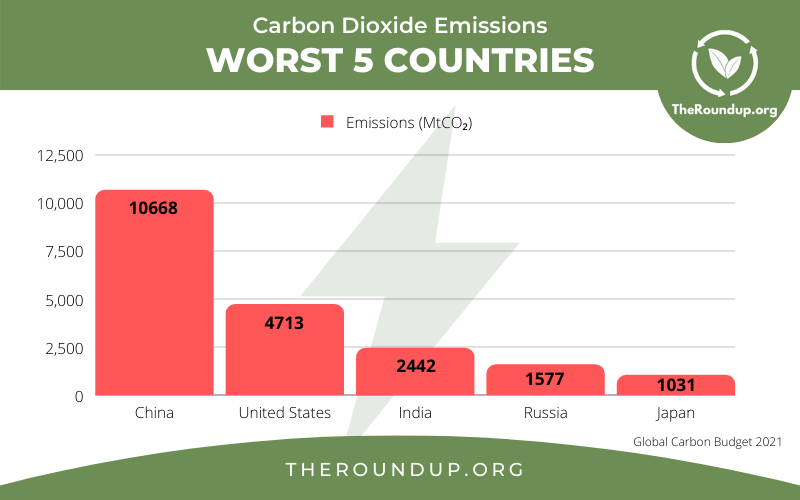
China (10668 MtCO₂) followed by the United States (4713 MtCO₂) emits more carbon dioxide than any other country.
China’s coal consumption has increased significantly over the last decade, leading to an increase in its emission levels of around 25% during that period.
China now produces more than twice as many emissions as the United States, which remains the second-largest emitter in the world.
Five countries are currently rated as producing zero or trace amounts of carbon dioxide (less than 0.1 MMtCO2e). These are:
Additionally, there are a further 5 countries for which no data is available: Cayman Islands, Gibraltar, Western Sahara, Reunion & Falkland Islands.
The US has produced more carbon dioxide than any other nation in history.
Although China is currently the largest Co2 polluter, the USA remains the largest cumulative emitter in history.
Since the industrial revolution, the USA has produced in excess of 410 billion metric tonnes. China is second with nearly 220 metric tonnes, followed by Russia (113) Germany (92), and the UK (78).
Yes. US greenhouse gas emissions peaked in 2007.
Between 1990 and 2007, US greenhouse gas emissions grew by more than 15%, peaking at 7,450 MMtCO2e (million metric tons of carbon dioxide equivalent) in 2007.
However, since then emissions have been on the decline, thanks to a move towards cleaner renewable energy sources.
There is still much work to do. There were still 4713 MMtCO2e emitted in 2020. But things are at least moving in the right direction, albeit not quickly enough. Joe Biden has promised that by 2030, emissions will be at least 50% less than 2005 levels. But a more ambitious target from all industrialized countries is needed to avoid a global climate crisis.
According to Net Zero Tracker, there are currently 6 countries in 2026 that have achieved either net zero or carbon neutrality:
None of these countries have zero emissions, however, they each have self-declared government data showing that they remove as much or more carbon from the atmosphere as they emit.
As of July 2026, according to Net Zero Tracker, there are 15 individual countries that have written in law that they will become net-zero or climate neutral by (or before) 2050.
In addition, the European Union bloc has made the same legal commitment.
Whilst these nations have a legal commitment to achieve this target, there is no guarantee at this stage that any or all will actually be able to fulfill this commitment.
Of the nations listed above, so far Germany, Hungary, and Japan have not published any detailed plan of how they intend to achieve their target.
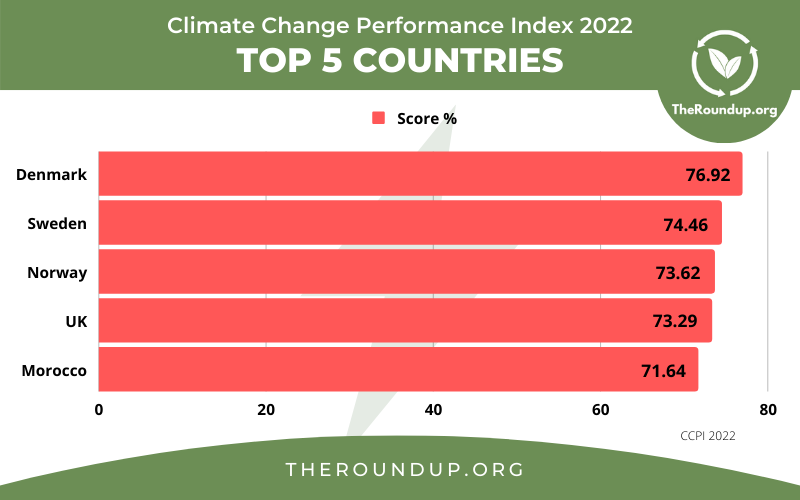
The Climate Change Performance Index (CCPI) tracks and measures the performance of 60 countries (plus the EU) in terms of the actions they take to protect against climate change.
According to the 2022 CCPI, Denmark is the country that is doing the most to protect against climate change.
The index is made up of scores in four categories: GHG Emissions, Renewable Energy, Energy Use, and Climate Policy. These are weighted to produce the overall score.
It should be noted that whilst the countries shown above are rated highest, no country has achieved a “very high” CCPI rating, which means nobody is doing enough to prevent climate change.
The Global Climate Risk Index by Germanwatch analyses the risk to countries from extreme weather events (flooding, storms, droughts, and heatwaves) caused by climate change.
The index combines risks of human fatalities with economic risks to provide an overall score.
According to this analysis, Mozambique, Zimbabwe, The Bahamas, Japan, and Malawi are the countries likely to be at the greatest overall risk from climate change.
There are limitations to the Global Climate Risk Index. For example, it does not take into account longer-term impacts such as rising sea levels.
This is why it does not mention those smaller low-lying island nations that are at risk of disappearing entirely.
These include the Maldives, Solomon Islands, Cook Islands, Tuvalu, Vanuatu, Samoa, and some Fijian islands.
Norway is likely to be the country that is least affected by climate change.
The ND-GAIN Country Index compiled by Notre Dame University combines 45 core indicators that measure a country’s vulnerability and readiness to resist the effects of climate change.
These metrics are combined to produce an overall score that predicts the degree to which each country will be affected. The top 10 is shown in the table below, higher scores are better.
| Rank | Country | ND-GAIN Score | Income Bracket |
|---|---|---|---|
| 1 | Norway | 76.2 | Upper |
| 2 | Finland | 73.3 | Upper |
| 3 | Switzerland | 72.4 | Upper |
| 4 | Sweden | 72.2 | Upper |
| 5= | Denmark | 71.6 | Upper |
| 5= | New Zealand | 71.6 | Upper |
| 7 | Austria | 71.5 | Upper |
| 8 | Singapore | 71.2 | Upper |
| 9= | Germany | 70.6 | Upper |
| 9= | Iceland | 70.6 | Upper |
Perhaps unsurprisingly, all of the top 10 countries that are most resistant to climate change are in the upper-income bracket in terms of their GDP. In general, poorer nations will be hit hardest if global temperatures continue to rise.
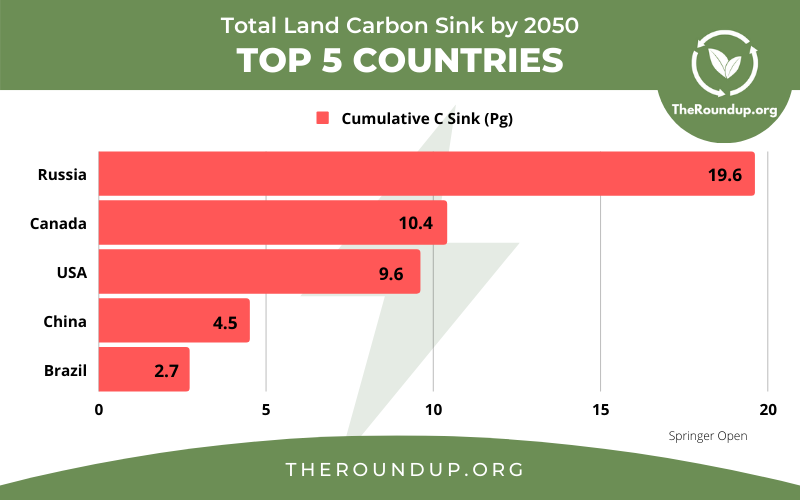
The natural absorption of carbon (also known as C Sink) by natural ecosystems (oceans and terrestrial means such as forests) has been traditionally difficult to quantify. But it should be taken into account when calculating our future net emissions both globally and on a per-country basis.
A study by Springer Open developed a methodology to predict land-based C Sink potential for different countries by 2050.
It found that Russia, Canada, the United States, China, and Brazil were the countries with the greatest potential to absorb carbon (land Carbon Sink) by the year 2050.
The top 20 countries were found to have the potential to absorb 62 Pg (PentaGrams, also known as Gigatons) of carbon in total.
The study noted that effective management of regional ecosystems will be required in order to realize this potential.
The EPA, UN, and EU all agree that the major causes of global warming/climate change are as follows:
All of the above causes are a result of human activities.
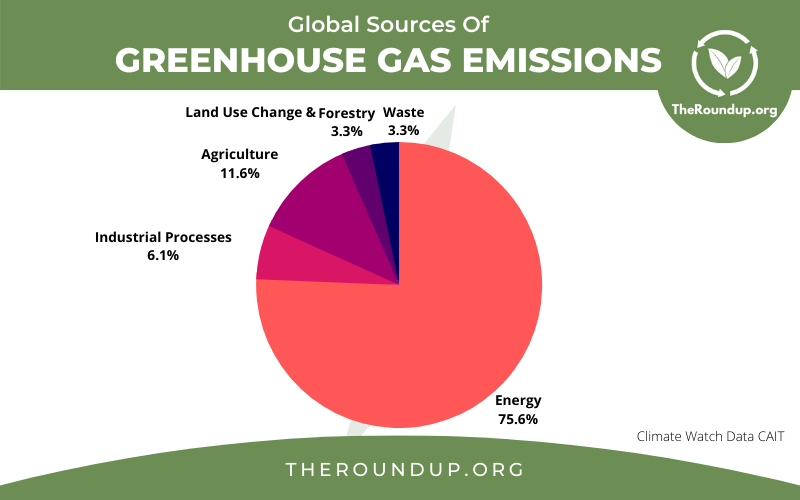
The primary source of greenhouse gas emissions is the energy sector.
The latest CAIT climate watch data shows that energy accounts for 75.6% of total global GHG emissions. This has remained stable in percentage terms over the past 5 years.
Of course, "energy" is a fairly broad term and can encompass many different things. It is therefore useful to break down this sector into subsectors to get a better idea of where the emissions are coming from.
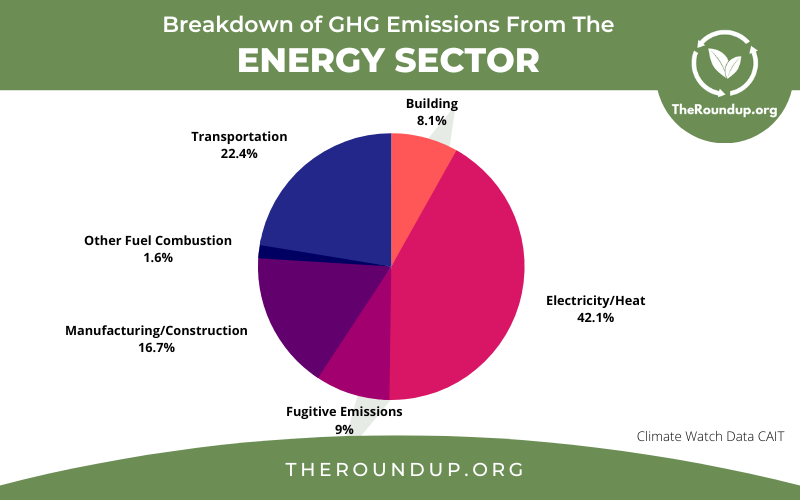
Electricity and heating produce the most greenhouse gas emissions, being responsible for 15.83 Gigatons CO2e (carbon dioxide equivalent) or 42.1% of the total.
Transportation is the second-largest subsector, producing 8.43 Gt or 22.4%.
We estimate that CO2 from cars and other passenger transport vehicles accounts for around 7.5% of total global greenhouse gas emissions.
We already know from the sources above that the energy sector makes up 75.6% of global GHG emissions and that 22.4% of that comes from transportation. This makes transportation 16.93% of the overall total.
Emissions from the transportation subsector can then be broken down further using data from the IEA.

Passenger road vehicles make up 44.4% of the total transportation emissions (16.93 x 0.444), which equates to 7.51% of the overall global total.
The IEA data above shows that overall, passenger vehicles including cars produce 50% more CO2 annually than trucks and road freight vehicles.
However, that isn’t necessarily a useful comparison, as there are far more cars on the roads than there are freight trucks.
To answer the question, it is more useful to compare the average co2 emissions per mile.
Clearly, there will be a huge variance when it comes to individual passenger vehicles. Factors such as age, weight, engine size, fuel type, maintenance, and driving style will all have an influence.
Again, this figure will vary depending on many of the factors listed above, as well as the weight of the load that the truck is carrying.
However, allowing for these caveats, on a one-to-one basis it is reasonable to state that a truck does produce more CO2 pollution than a car.
Clearly, an aircraft produces far more CO2 than a car over the same distance.
However, these emissions are divided between the number of passengers on board in order to get the individual carbon footprint.
Aviation intelligence group the IBA, in association with KPMG, estimates that the global average CO2 emissions on commercial aircraft, per seat, per mile, is 144.2g.
As a reminder, the data above puts the average passenger vehicle at 404g per mile.
This means that, over a long distance, flying on a full aircraft can be less carbon-intensive than driving a car by yourself.
Globally, carbon dioxide emissions, which are caused by burning fossil fuels, account for around 75% of total greenhouse gas emissions by volume.
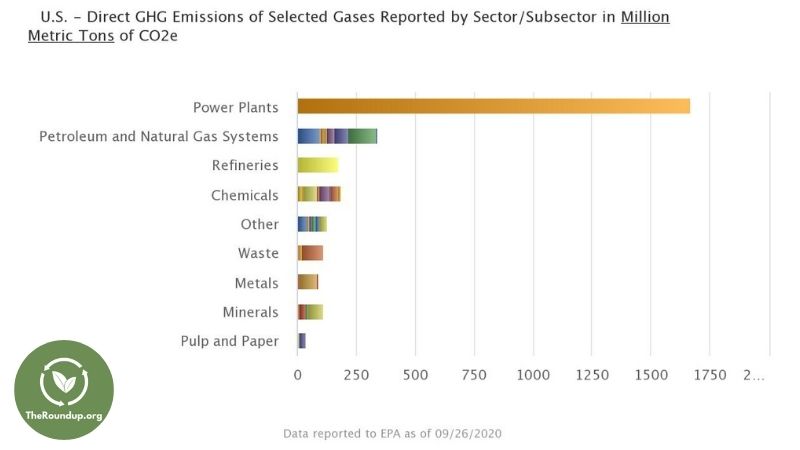
The EPA provides more granular data to show the comparative emissions in the US.
Power Plants (1667 million metric tonnes), Oil & Gas (340 MMT) and Refineries (177 MMT) are the three highest sources of greenhouse gas emissions in the United States.
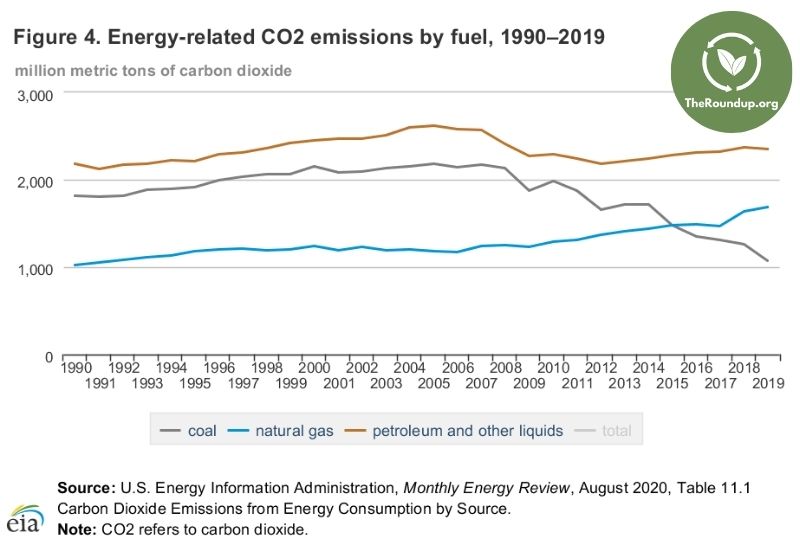
In 1990, the U.S. had 1.1 billion metric tons of energy-related emissions from natural gas and by 2018, it had reached 1.7 billion metric tons, or an increase of 50%.
Coal has been steadily declining over this time with only 1.1 billion metric tons of emissions in 2018 which is less than half of coal's peak in 2000 with 2 billion metric tons of energy-related carbon dioxide emissions at that time.
This decline is due to coal having a smaller share in the power mix for electricity production as people move away from it because it pollutes more than natural gas. At the same time, renewables like wind and solar are becoming more popular sources of power generation as awareness of climate change increases globally.
Cutting down trees increases global warming in two ways:
Most people are aware that trees and plants remove carbon dioxide from the air when they photosynthesize.
So it stands to reason that the fewer trees we have, the less capacity they have to remove greenhouse gases from the atmosphere.
However, trees do not use all of the carbon that they absorb. The remainder is stored (or sequestered) in their trunks and roots.
So when trees are cut down, this surplus carbon is released back into the air, further increasing the concentration of GHGs and contributing to global warming.
A mature tree absorbs on average 48 lbs (22kg) of carbon dioxide every year.
That’s nearly 60 grams per tree, every single day.
Not all trees absorb the same amount of carbon. Those trees that are blessed with thick trunks, large leaves, and broad crowns will generally absorb the most.
The oak tree is known as being the best absorber, with pines and mangroves also doing an excellent job.
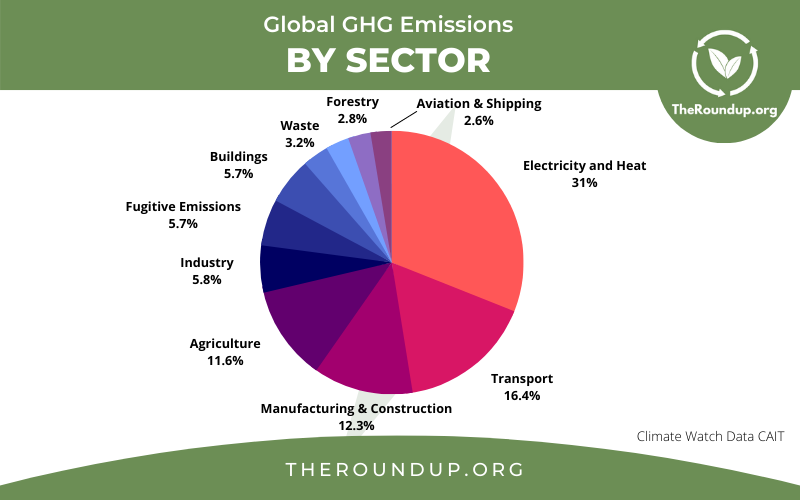
Electricity and Heat generation (primarily from power stations) is the biggest polluting sector globally, in terms of total GHG emissions.
By viewing the CAIT data on a per-sector basis, we can compare emissions from various sectors and see that Electricity and Heat is responsible for 31% of total global emissions.
Transport (16.4%), Manufacturing and Construction (12.3%), and Agriculture (11.6%) are the next most polluting sectors.
Given that we already know that most GHGs come from burning fossil fuels, these figures are in line with our expectations. But they reveal how much impact a transition to renewable energy sources would have if adopted globally.
The latest figures reveal that 11.6% of greenhouse gases come from agriculture.
The majority of these emissions are not carbon dioxide. They are methane (CH4) from cattle and livestock, and nitrous oxide (N2O) from pesticides and fertilizers.
Given the relative potency of these gases, agriculture remains a major contributor to climate change, which is why many environmentalists encourage people to eat less red meat and adopt a more plant-based diet.
In general, the richest people in the world have the biggest carbon footprint.
A report by the charity Oxfam, in conjunction with the Stockholm Environment Institute, estimated that the wealthiest 10% of people produced 52% of the total global emissions over a 25 year period.
This carbon inequality becomes more pronounced as you move further up the wealth scale. The report found that:
In terms of individual people, the report did not name names, and indeed it is far harder to calculate cumulative emissions on an individual basis, although various news outlets have attempted to do so.
The Independent newspaper names Bill Gates, Paris Hilton, Emma Watson, and Jennifer Lopez as “super emitting celebrities” while The Print names Elon Musk, Roman Abramovich and Bill Gates (again) as their main culprits.
The data on individual lifestyles is lacking, but the Oxfam report has some substance and therefore it is certainly fair to conclude that the wealthiest individuals from the wealthiest nations have contributed disproportionately to climate change.
Given what we have already learned, it’s not surprising to learn that the biggest emitters in the US come from the energy sector.
Vistra Energy (119 million metric tons), Duke Energy (99 million) and Southern Company (97 million) top the list of companies that were responsible for emitting the most greenhouse gas in 2018, according to a study released in 2021.
This is because these companies rely heavily on coal fired power stations for their electricity generation. Vistra has at least announced an intention to close some of its coal burning plants by 2027 and replace them with renewable energy sources.
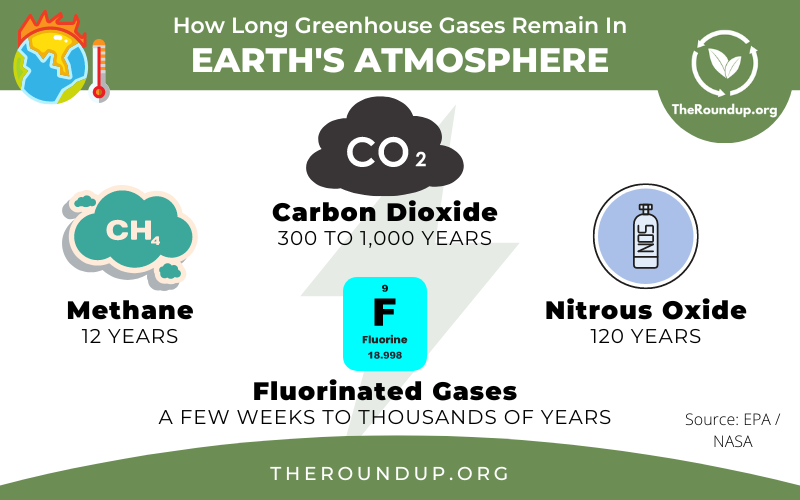
The length of time that greenhouse gases remain in Earth’s atmosphere varies depending on the type of gas, but they can linger for hundreds or even thousands of years.
These statistics underline the fact that even if we stopped all man-made emissions today, it would not prevent or reverse climate change. The gases we emit today will affect life on Earth for many generations to come.
The effects of climate change are wide-ranging and severe.
We’re beginning to feel them already, but what we have seen so far is only a preview of what scientists believe is likely to happen by 2100 if we do not do anything to prevent further global warming
The IPCC predicts that the likely effects will include:
Global warming cannot be prevented, it is happening already. But scientists believe there may still be time to prevent the worst effects if we can keep temperature rises below 1.5 degrees.
To achieve this would require a collective effort on behalf of governments and individuals. Any action we take that directly or indirectly results in fewer fossil fuels being burned will help.
Things that we can do as individuals might include:
Yes. We cannot prevent climate change from happening, since it has already started, but global warming can be reversed in time.
It is possible to achieve a scenario when greenhouse gases in the atmosphere stop increasing and begin to decline. This point is known as “drawdown”.
A worldwide research group, known as Project Drawdown, has compiled a list of 100 existing or emerging technologies and solutions.
It believes that, if these are all adopted and implemented aggressively and in parallel, it would be possible to begin to reverse global warming before 2050.
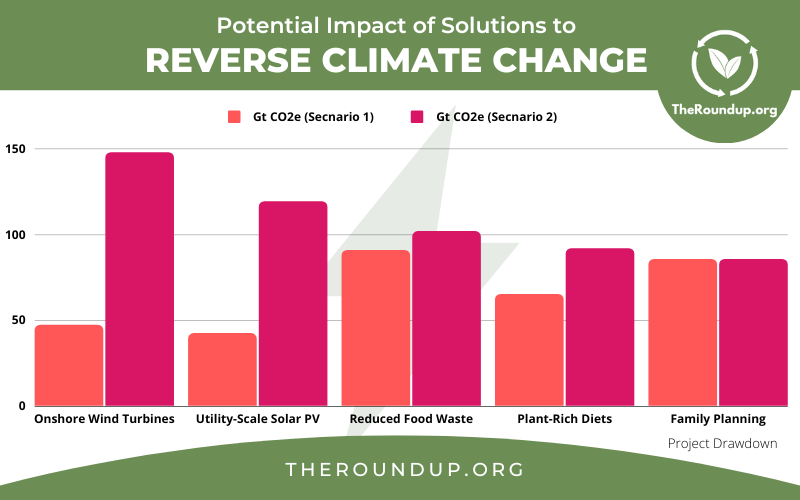
The project operates two different scenarios and assesses the impact of various solutions based on each.
The graphic above shows the amount of co2 equivalent that can be reduced or sequestered by the 5 most impactful solutions, ordered by their impact under scenario 2, the most optimistic.
The 2021 Global Carbon Budget Report estimates that we only have until 2030 to prevent irreversible damage from climate change.
Considering the length of time that GHGs remain in the atmosphere, there is a 50/50 chance that we could reach a situation whereby a rise of 1.5˚C by the end of the century is already “locked in” by the early 2030s if we do not take action to reduce emissions now.
Carbon dioxide can be removed from the atmosphere either by natural ecosystems, or man-made Direct Air Capture and carbon capture technologies.
Yes, rain does remove small amounts of carbon from the atmosphere. When atmospheric CO2 comes into contact with water vapor, it forms a weak carbonic acid which falls as rain. It is this process that is gradually making the oceans more acidic.
However, this cycle can only remove a very small percentage of carbon from the atmosphere, and cannot be considered a solution to climate change.
Also, depending on where the rain falls, the carbon may not be stored and could end up evaporating straight back into the atmosphere again.
If the Earth had no greenhouse gases at all, our average temperatures could drop to around –18˚C (–0.4˚F), according to National Geographic.
Many species would be unable to survive. In short, most of us would freeze to death.
Greenhouse gases have a bad name, but they are actually essential for life as we know it.
They occur naturally and act to trap heat from the Sun’s rays and the Earth’s surface within our atmosphere (in the same way that a greenhouse does), which is what allows our planet to support life.
The problem is that when we produce too many GHGs, they do too good a job and trap too much heat, which is what causes climate change.
Yes - overall, particulate matter emissions In The US are falling.
The air pollution levels in the U.S. (measured by PM2.5 levels) has in fact reduced by almost half since the year 2000.
Particulate matter, or PM is a complex combination of extremely small particles found in the air. Some are emitted directly from a source, such as dust from construction sites and vehicle exhaust. Others form in the atmosphere when other types of air pollution react or combine.
Particulate matter is one of the main causes of deaths related to air pollution in America today.
Deaths attributable to air pollution are reducing in the US.
The EPA estimated that in the United States in 2018, 13% of deaths were caused, at least in part, by the inhalation of fine particulate matter that is created by burning fossil fuels.
However, over the last 30 years, the number of people who have died from air pollution in the United States has gone down. In 1990, an estimated 103,700 people died because of air exposure. By 2019, despite a slight increase from 2017 levels, this figure had fallen to 60,200.
California was the most polluted US state in 2020, based on PM2.5 concentration levels. This is because of the wildfires that ravaged the area during that year. The smoke from the fires comes into many cities and leaves them exposed to high levels of air pollution.
Yosemite Lakes, Springville, and Susanville were the worst 3 cities. Yosemite Lakes had nearly 4 times the target level of PM2.5 as specified by the World Health Organization.
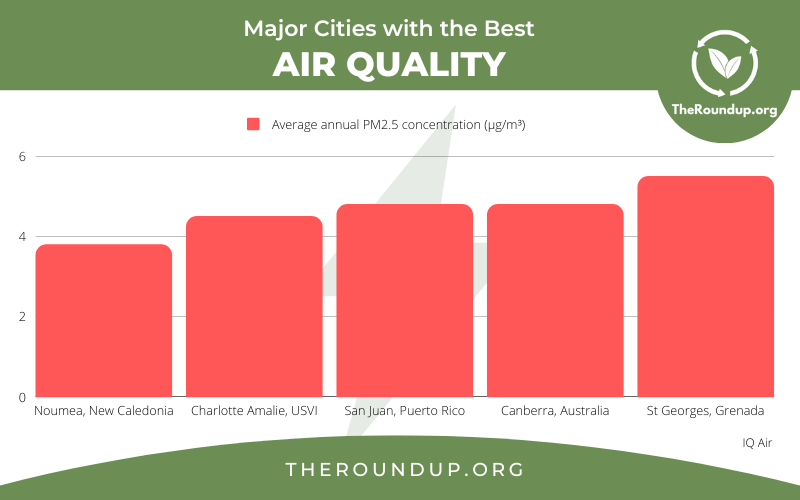
Noumeau, the capital of the South Pacific nation of New Caledonia, had the cleanest air of any major world city in 2021.
The World Air Quality report ranks all major regional cities according to their average annual PM2.5 concentration
Noumeau was one of just four cities that met the WHO PM2.5 guideline of 5 µg/m³ or less.
The others were Charlotte Amalie (US Virgin Islands), San Juan (Puerto Rico) and Canberra (Australia).
The worst air quality was in New Delhi (India) which had a staggering 85 µg/m³.
The evidence is clear. Climate change is no longer a problem for the future. It is a problem that is happening now and needs to be dealt with now if we are to avoid doing permanent, serious damage that could destroy our planet and our entire way of life.
The worst effects can be prevented and the process can be reversed in time, but the window of opportunity is incredibly small.
The latest research, data and statistics on air pollution, CO2 and GHG emissions provide you with critical information about how your lifestyle choices are impacting our planet.
Whether that be as simple as changing a lightbulb or buying more eco-friendly products, we hope these numbers will help motivate you to make small changes in your daily life so that together we can do what is necessary to save the future of the Earth.
Do any of these stats surprise you? If not, what do they tell us about the current state of global warming? How does this affect future generations if nothing is done now? Let us know!
Global Carbon Project | NASA | NASA | ClimateWatch Data | OWID | IEA | IEA | IPCC | NatGeo | Health Effects Institute | University of Massachusetts | ProjectDrawdown | NOAA | EPA | EPA | EEA | Greenhouse Gas Reporting Program | EPA | IQAir | EIA | NCDC | NOAA | IEA | Global Carbon Budget | Net Zero Tracker | CCPI | GCRI | ND-GAIN | Springer Open | Oxfam