

When you're thinking about installing a wind turbine, one of the most important considerations is the power output. How do you figure out how much power your turbine will produce?
This guide explains how to calculate mean wind turbine power output, and why you should care.
Note that this is not the same as simply calculating output based on an average wind speed! This formula will give a more accurate representation of the power you can expect to get from your domestic wind power installation over time.
(Original article and sketches by Dr. Les Bardbury / PelaFlow Consulting)
Contents
Due to the non-linear variation of power with steady wind speed, the mean power obtained over time in a variable wind with a mean velocity Um is not the same as the power obtained in a steady wind of the same speed.
The sketch below shows a power output curve W(u) for a Vestas 90-meter 2-megawatt turbine in a steady wind of speed u. Also shown is the probability density distribution p(u) for a particular mean speed Um of 6 meters/second.
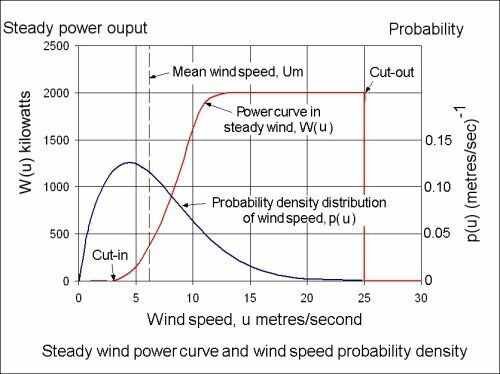
The final mean power at a mean wind speed Um is the steady power W(u) multiplied by the probability density distribution p(u) and summed (i.e. integrated) over all the range of wind speeds.
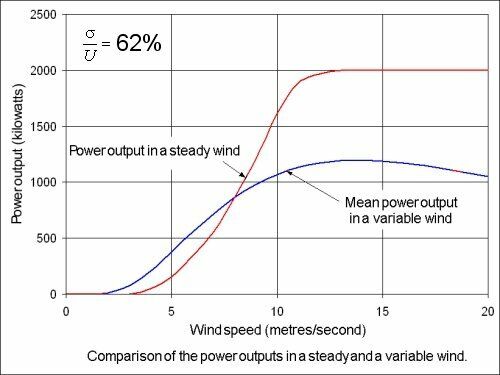
Thus, the mean power Pm(Um) at a mean speed Um is given by
This integral is evaluated over a range of mean wind speeds from 5 meters/second through to 10 meters/second in 0.2 meter/second steps.
This encompasses the range of mean wind speeds likely to be encountered in the vast majority of cases.
In most wind power calculations, the default value of the standard deviation is set at 52% of the mean wind speed - which is the Rayleigh distribution (Weibull k parameter of 2) used as the reference standard deviation by the wind industry.
The evaluation of the integral uses simple trapezoidal integration (see below for a discussion of the accuracy of this numerical scheme) by comparing the numerical integration with an analytical solution for a box-like power curve. It is shown that errors in the numerical scheme are small at less than half a percent.
It should be noted that the above equation does not take into account the dynamics of the turbine in responding to rapid changes in wind speed.
For very large turbines, this is probably not too significant but for small turbines with various mechanical devices used to avoid overspeeding and damage at high wind speeds, the neglect of the rotor dynamics might make estimates of mean power at higher wind speeds a process of uncertain accuracy.
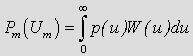
The sketch below shows a comparison between the mean power output in a variable wind compared with the steady wind power curve.
The influence of the unsteady component of the wind on the mean power output is rather typical of most turbines in that at mean speeds below around 8 meters/second, the mean power output is greater than the steady power output values. This is due to the weighting from the upper end of the speed variations on the steep part of the power curve.
Above this speed, the situation reverses because the high-speed components of the wind speed are now reaching the flat part of the power curve and may even reach as far as the cut-out part of the power curve.
It should be noted that there is never a practical circumstance where the mean power output reaches anything like the rated power output.
It is therefore a very misleading practice when the rated output of a wind turbine is quoted as if this was the available power from an installation. It has caused great confusion in discussions about the power contributions that wind turbines can make.
The ratio of the mean power produced at a particular mean speed to the so-called rated power output is called the capacity factor.
This is itself a function of mean wind speed and so has no more significance than the mean power outputs themselves. As can be seen from the results above, it ranges from about 0.2 at a mean wind speed of 5 meters/second to about 0.5 at 10 meters/second.
The numerical integration of the mean power integral was performed with a simple trapezoidal method, namely
![]()
where p(n) and W(n) are the values of the steady power curve and the Weibull probability distribution respectively at the nth wind speed step where the steps are in 1 meter/second ranging from 0 to 30 meters/second. ΔU is the speed increment which is 1 meter/second.
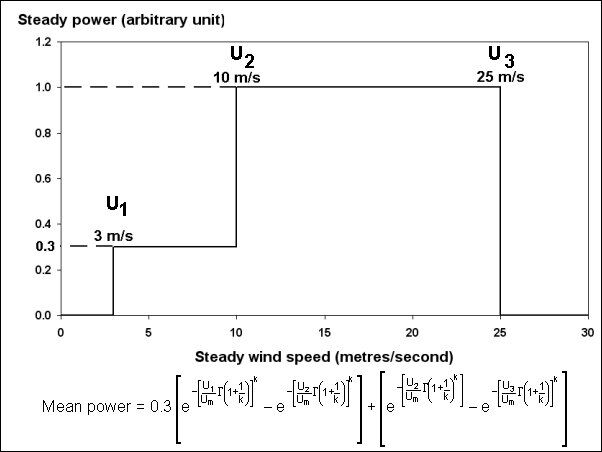
As a check on the numerical accuracy, a comparison was made with a box-like power curve as shown in the figure below.
The assumed form is that the power output is constant at 0.3 power units between 3 and 10 meters/second and constant at 1 power unit between 10 and 25 meters/second. The power is zero at all other speeds.
With the Weibull distribution, this power distribution has an analytic solution shown in the figure below. This is a rather severe test of the numerical integration scheme because practical power curves have a smooth behavior.
The figure below shows the results of the comparison in the form of the ratio of the analytic mean power value and that computer numerically using the trapezoidal rule.
The calculations were carried out for three values of the standard deviation of the wind speed fluctuations of 52% (the Rayleigh distribution), 80% (a turbulent urban environment), and 40% (a very steady wind on an ocean island or some desert areas).
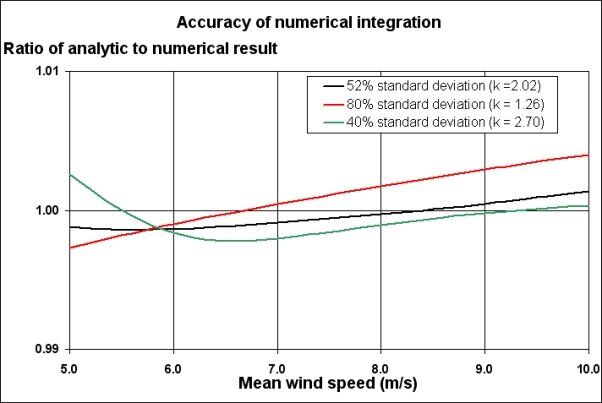
It can be seen that there is less than a 0.5% difference between the analytic results and the numerical results which gives confidence in the accuracy of the simple trapezoidal integration scheme.
An increasing number of people are looking to adopt a greener lifestyle these days, and along with making more eco-friendly purchasing choices, a switch to renewable energy is often seen as a key part of that lifestyle switch. However, as appealing as the idea of a wind turbine may be, it is not the right choice for everyone and you need to spend some time calculating how much energy your turbine would produce before making the investment.
Once you know what your mean power output is likely to be, you can calculate how much of your energy needs a turbine can meet, and whether it is worth the investment or whether alternative renewable energy sources might be a better option.