

Solar power is an energy source that has been around for quite some time. It’s only recently, however, that people have begun to truly understand the potential of this energy source and how it can help the world transition away from fossil fuels.
In this article, with the help of charts and key statistical data, we reveal the latest solar power statistics that demonstrate how the industry has grown so far, and the outlook and potential for the future.
We will examine several key areas including output, installations, costs, and employment in the sector.
Contents
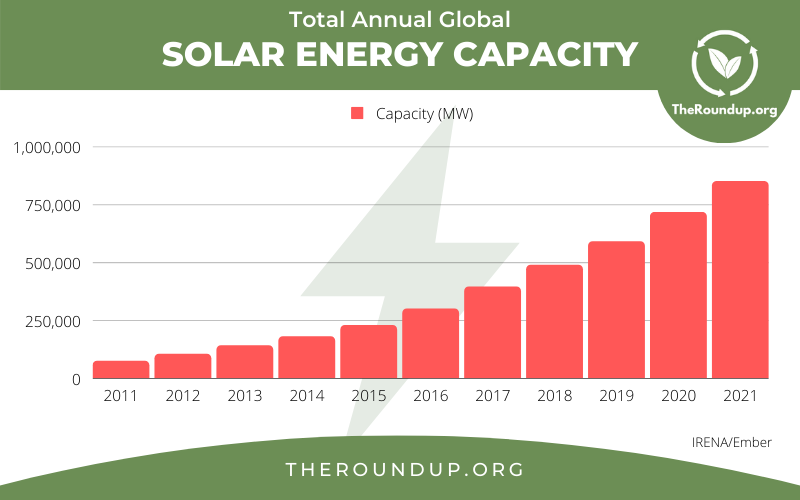
The world’s current solar energy capacity is 850.2 GW (gigawatts).
This is the maximum amount of energy that all global solar installations combined can produce at any one time.
This figure has increased every year for the last decade and is more than ten times higher than it was in 2011, according to the latest data from IRENA and Ember.
However, it is estimated that up to 173,000 TW (terawatts) of solar energy can hit the Earth at any given moment. So we are still only using a tiny fraction of the energy available to us, which is far more than we are ever likely to need.
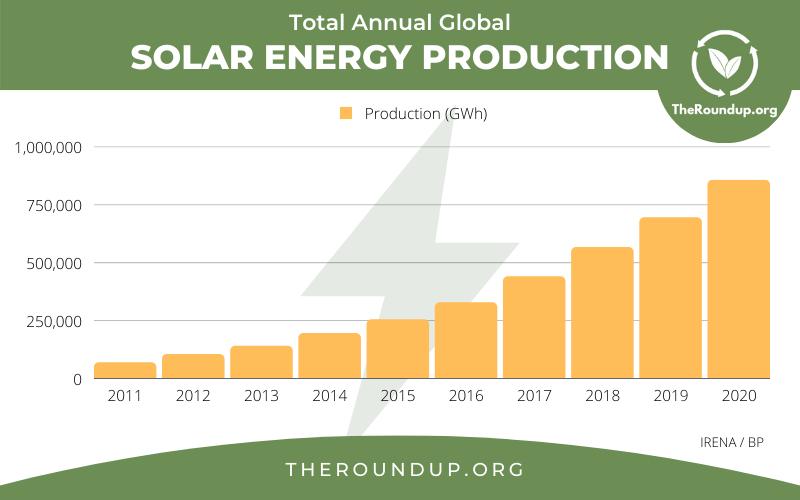
The latest available figures show that the world used 856 TWh (terawatt hours) of solar energy in 2020.
The solar energy production figures have also risen over the last decade, in line with capacity. Production is now more than ten times what it was in 2011.
Around 4.4% of total global energy came from solar power in 2021.
This is an increase from 3.3% in 2020.
Renewables as a whole contributed 38% of overall electricity generation (according to Ember Climate), and solar accounted for 11.5% of total renewables (see below). This gives an overall figure of 4.37%.
In the US alone, the figure is slightly lower. The latest data shows solar producing 3% of total US electricity in 2020. The EIA predicts that this share will increase to 20% by 2050.
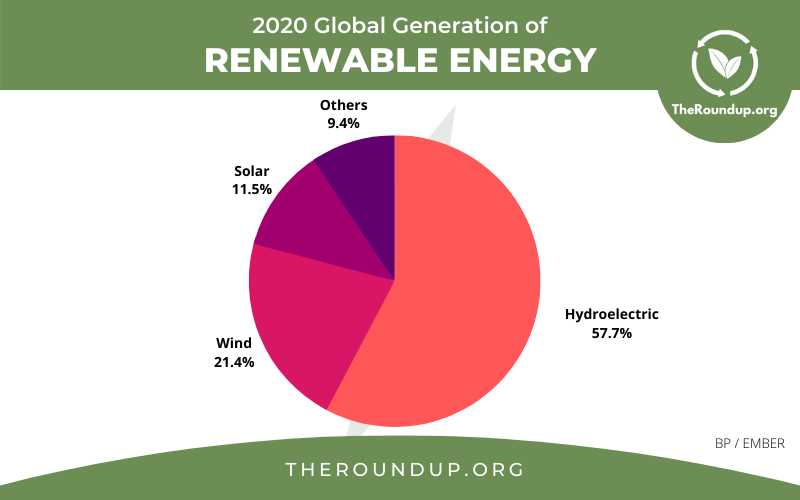
11.5% of global renewable energy comes from solar power.
The largest renewable source is currently hydroelectric (57.7%) followed by wind (21.4%), according to the BP Renewable Energy Review.
However, solar capacity is expanding at a much faster rate than any other renewable energy source, which means its share will increase in the future.
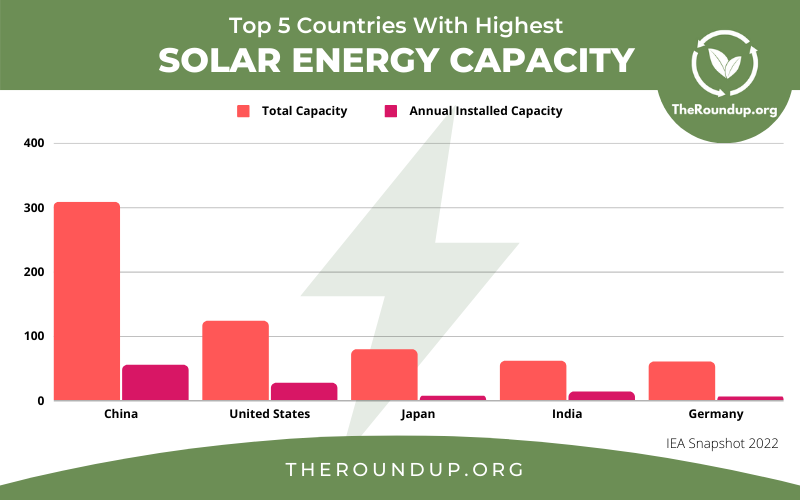
China has the highest cumulative solar energy capacity in the world. The IEA measures China’s current capacity at 308.5 GW.
The US is next with 123 GW of solar capacity. Japan has 78.2GW.
China also installed the most additional solar in 2021, increasing its cumulative capacity by 54.9 GW. This was more than twice the amount added in the US (26.9GW).
Although it remains the world’s largest emitter of greenhouse gases, this shows that China is clearly taking steps toward satisfying some of its huge energy needs with renewables.
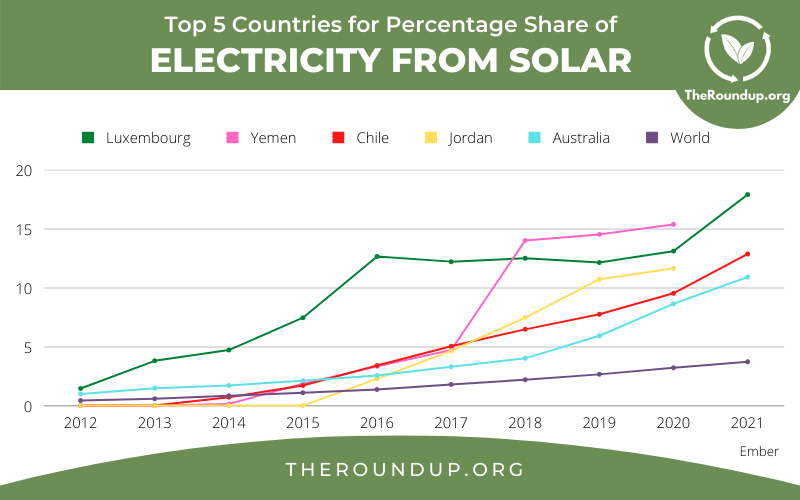
Luxembourg (17.9%), Yemen (15.4%), and Chile (12.9%) are the countries that produce the highest percentage of their electricity from solar, according to the latest Ember Climate data from 2021.
Jordan (11.7%) and Australia (10.9%) are next on the list.
All of these countries are above the world average of 3.7%.
It is interesting to note that countries such as Jordan, Yemen, and Chile did not use any solar energy at all 10 years ago, but have since adopted and rapidly come to rely on it as part of their overall energy strategy.
Saudi Arabia, Turkmenistan, Hong Kong, Qatar, Oman, Libya, Kuwait, and Bahrain are some of the countries that do not yet use solar power in 2024.
Solar PV infrastructure can be expensive to install and has certain logistical considerations. It requires space, connectivity, and enough sunlight to make it a worthwhile investment.
However, some countries that don’t use solar are not bound by these constraints, yet still continue to source all of their electricity from fossil fuels.
Iceland is at 100% renewable power in 2024 and Paraguay, Costa Rica, and Norway are at virtually 100%, using only minute quantities of fossil fuels.
These countries get most of their renewable energy from hydro and geothermal.

The latest 2021 annual statistics show that 3.9% of US electricity comes from solar power, up from 3.2% the previous year.
Solar provided 0.95% of electricity in the US in 2015, and just 0.03% in 2010.
Although solar still only provides a small fraction of our electricity, the trend shows that its usage is growing strongly year on year, and this is expected to continue over the next decades as we seek to end our reliance on fossil fuels.
Bhadla Solar Park in Rajasthan, India is considered to be the world’s largest solar plant in 2024 with an estimated installed capacity of 2.25 GW.
Huanghe Hydropower Hainan Solar Park in China (2.2 GW) and Pavagada Solar Park in India (2.05 GW) are also among the world’s top sites.
| Rank | Name | Country | Capacity (GW) |
|---|---|---|---|
| 1 | Bhadla Solar Park | India | 2.25 |
| 2 | Huanghe Hydropower Hainan Solar Park | China | 2.2 |
| 3 | Shakti Sthala Solar Project | India | 2.05 |
| 4 | Benban Solar Park | Egypt | 1.65 |
| 5 | Tengger Desert Solar Park | China | 1.55 |
It is difficult to produce accurate comparisons between the world’s biggest solar plants, due to ever-evolving technology and fluctuating capacities, so the list should be considered dynamic.
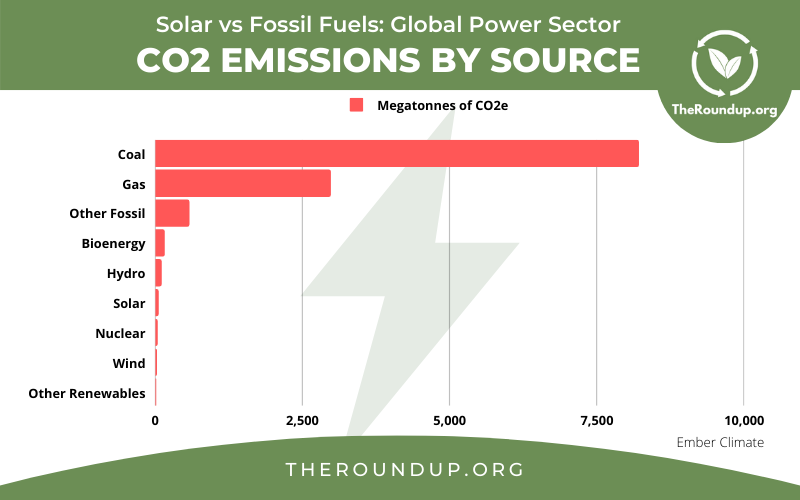
Yes, the annual carbon emissions data associated with solar energy are significantly less than those of fossil fuels.
According to the latest 2021 Ember Climate data, Coal emitted 8204.6 MT of CO2e, and gas emitted 2973.52 MT.
By comparison, solar energy emitted just 49 MT CO2e globally.
No, in 2024 we still get more of our global energy from fossil fuels than we do from solar or other sources of renewable energy.
Renewables have the potential to fulfill all of our energy needs, and the installed capacity of solar and wind is growing year on year.
However, fossil fuels remain the largest source of energy globally and that needs to change by 2030 if we are to reach net zero.
Solar power is far more efficient than fossil fuels, in terms of the amount of energy it can produce compared to the amount of energy needed to manufacture and construct solar installations.
Research published in the journal Nature Energy measures the EROI (Energy Return on Investment) of all major sources of power generation. This data shows how much energy is offset in the manufacture and installation/construction as a percentage of the total energy it can generate over its lifetime.
Solar PV installations require just 4% of their total capacity to produce and install. In other words, for every unit of energy “invested” in solar installations, they can return 26 units.
In contrast, a coal-fired power station has an 11% energy offset, even before you factor in the ongoing emissions of actually using it.
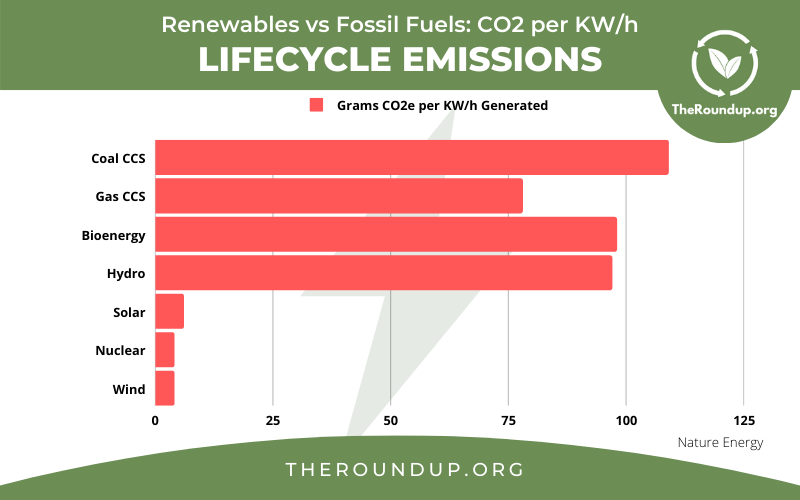
Yes, solar panels are significantly cleaner than coal or gas, even if CCS (carbon capture and storage) is used.
This remains true even after accounting for emissions generated during the manufacture and construction of solar farms and panels.
Incorporating the EROI data described above, the Nature Energy study was able to estimate the overall emissions footprint of each major energy source over its lifetime.
Nuclear and wind would produce 4gCO2e/kWh - that’s 4 grams of CO2 equivalent per kilowatt-hour of electricity generated. Solar would produce 6gCO2e/kWh.
In comparison, coal with CCS (109g), gas with CCS (78g), hydro (97g) and bioenergy (98g) have significantly higher emissions footprints.
Therefore, despite some critics claiming that “hidden emissions” make the building of solar farms and wind turbines inefficient, the data proves that the opposite is true.
It is in fact far more efficient to invest in new renewable energy sources.

By the end of 2021, the solar industry had reached around 3.2 million residential installations in the US.
Wood Mackenzie estimates that 4.7% of viable owner-occupied homes in the US had a residential solar system by the end of the year.
Forecasts suggest that the number of American homes using solar power is expected to more than triple by the year 2030.
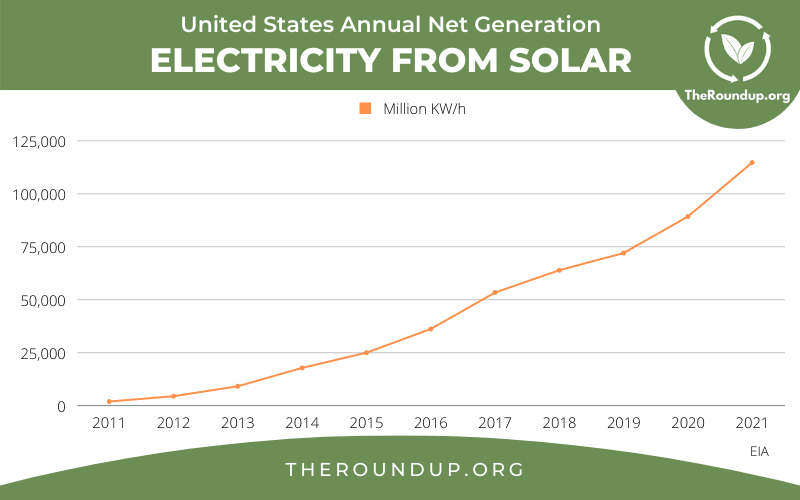
The US generated 114.7 terawatt-hours (TWh) of electricity from solar in 2021.
This is a cumulative figure, taking into account power generated from all sectors (commerical, residential, and community) according to EIA data sources.
The data shows the amount of solar electricity generated is increasing year on year, as more and more people see its benefits as an alternative source of energy.
In 2011 the US produced a total of just 1.8 TW). By 2015 this had grown to 24.9 TWh and in 2021 we saw more than four times that amount.
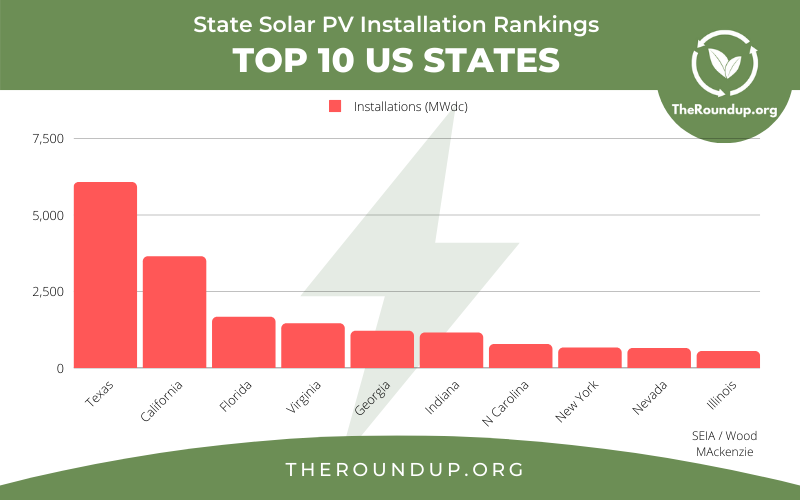
Texas is the state with the highest number of new solar installations in the US, followed by California and Florida.
Until 2021, California had lead the way in the US solar market for several years, but rapid growth in Texas saw it become the leading US state for solar installations for the first time.
Virginia, Georgia and Indiana are the next three states on the list.
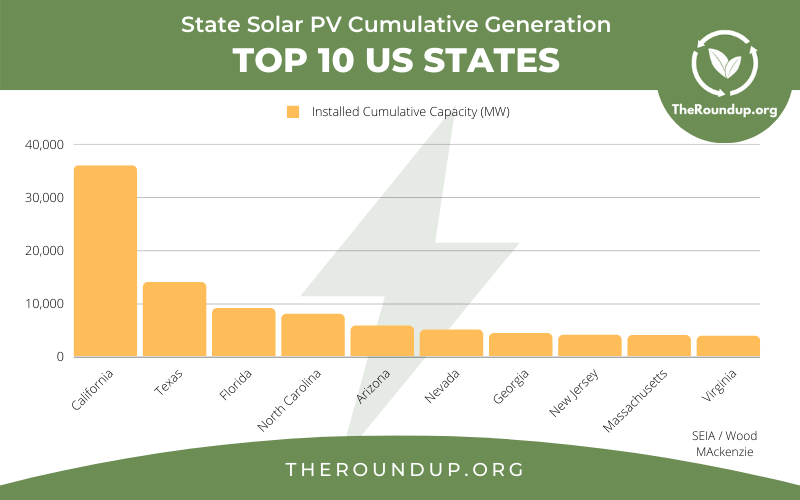
California (35.95 GW) continues to be the state that generates the most solar energy.
Despite rapid expansions in other states, the existing capacity in California meant it was able to generate more than two and a half times as much solar electricity as Texas (13.95 GW) and four times as much as Florida (9.01 GW) in 2021.
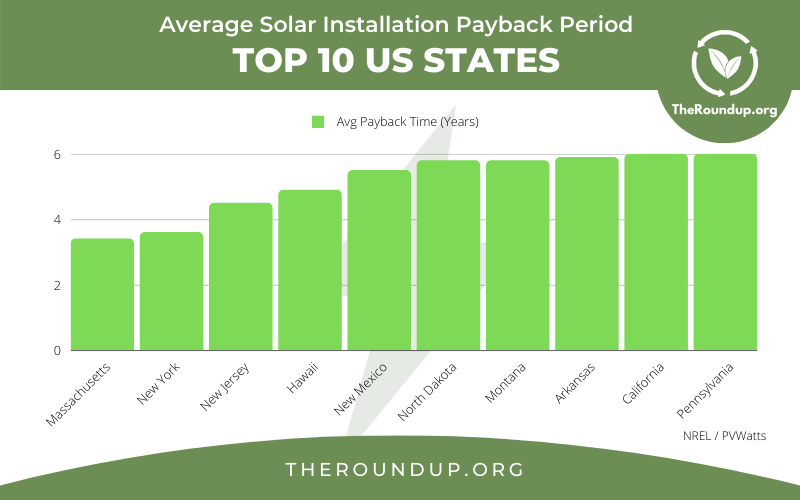
Most US residential solar installations will pay for themselves in 8-12 years.
The actual figure will vary depending on where you live, but anything less than 12 years is generally considered a good return on investment.
The cost of installation, the price of alternative electricity, the amount of sunlight, and government and state incentives are all factors which will affect the payback period.
Using the PVWatts calculator, and based on 2024 electricity prices and PV installation costs, we were able to calculate that on average residents of Massachusets (3.4 years), New York (3.6 years) and New Jersey (4.5 years) would find their solar panels paid for themselves the fastest.
See also: Are Solar Panels Worth It?

It would take around 18.5 billion solar panels to power the entire US in 2024.
In a 2017 NGA meeting, Elon Musk famously said that it would be possible to power the entire US by covering one small 100x100 mile square corner of Texas with solar panels.
We were able to calculate that his claim would still be accurate using the latest 2024 data.
We used the following assumptions:
The calculation is: 10000 * 0.21 * 0.23 = 483 GW.
Therefore, we calculate that it would still be possible to power the entire US with 10,000 square miles of solar panels.
At around 1,858,560 panels per square mile (according to terawatts), that’s eighteen billion five hundred eighty-five million six hundred thousand (18,585,600,000) panels.
When newly developed, highly efficient solar cells become commercially available, the space and number of cells required could drop dramatically.
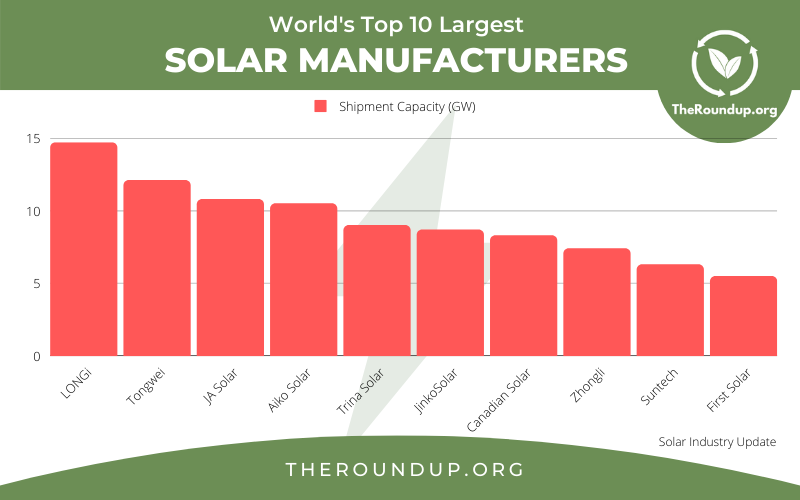
Chinese company LONGi Solar is the world’s largest solar panel manufacturer, producing 14.7 GW of solar capacity according to the 2021 Solar Industry Update.
In fact, the top 6 manufacturers are all Chinese. Tongwei (12.1 GW) is the second-largest, and JA Solar (10.8 GW) is third.
The largest manufacturer outside China is Canadian Solar with 8.3 GW.
First Solar is the largest manufacturer in the US, with 5.5 GW.
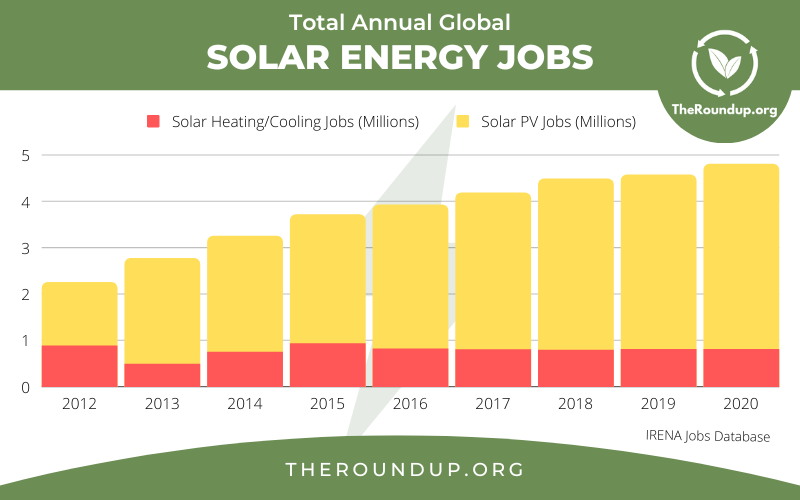
There are 3,975,096 people working in the solar PV industry worldwide, and 231,474 of these solar energy jobs are in the United States.
A further 820,00 people work in the solar heating and cooling sector globally, according to the latest statistics from the IRENA jobs database.
Yes, the global solar PV industry has seen an increase in employment year-on-year over the last decade.
There are now three times as many people working in the solar industry as there were in 2012.
Employment in the solar heating and cooling sector has remained relatively flat over the past decade.
China is the country with the highest number of solar industry jobs, accounting for 58% of the global total, according to the IRENA database.
This is no surprise considering that China is the world’s largest solar panel manufacturer, and also has the world’s largest solar energy capacity.
The United States, Japan, India, and Vietnam offer the next highest number of solar industry employment opportunities.
10.3% of workers in the United States solar industry are unionized, which is higher than the national average of 7.4%. This is likely due to the fact that solar installation is a skilled trade that requires training and certification.
Solar industry workers enjoy similar or higher wages than workers in similar jobs in other industries.
Solar electric power generation created 17,212 jobs last year, which was a 5.4% increase, according to the latest data from the US Department of Energy.
A further 4,085 jobs were created in related subsectors including batteries (for storage and electric bikes and vehicles) and smart grids.
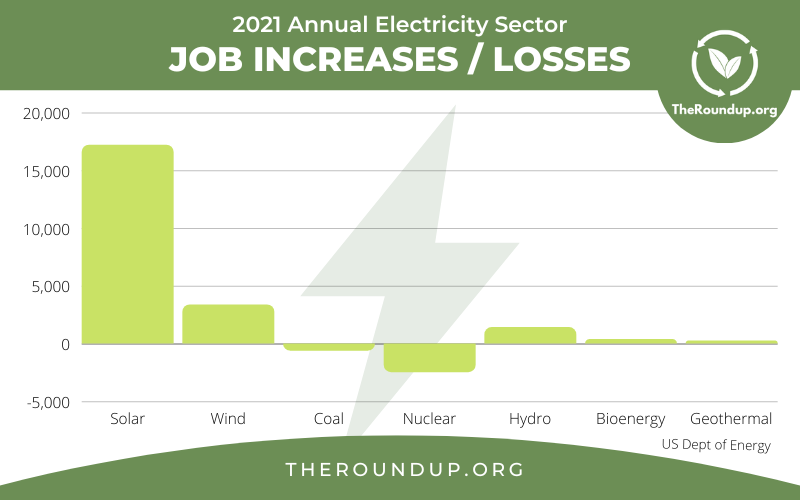
Solar power created more new jobs than any other energy source in 2021 according to the US Department of Energy.
Wind and hydropower ranked 2nd and 3rd in terms of job creation, whereas the coal and nuclear sectors saw job losses as compared to 2020.
Electric Power Sector Jobs Created/Lost in 2021
| Rank | Subsector | Jobs Created/Lost | Percentage Change |
|---|---|---|---|
| 1 | Solar | + 17,212 | + 5.4% |
| 2 | Wind | + 3,347 | + 2.9% |
| 3 | Hydropower | + 1,383 | + 2.2% |
| 4 | Bioenergy | + 349 | + 2.9% |
| 5 | Geothermal | + 220 | + 2.8% |
| 6 | Coal | - 572 | - 0.8% |
| 7 | Nuclear | - 2,440 | - 4.2% |
No - the wind, hydro and solar energy job statistics above show that renewable energy creates far more jobs than it removes.
As we transition from fossil fuels to renewable energy, it is inevitable that jobs in the fossil fuel sectors will decline, but more highly skilled, highly desirable, and better-paid jobs are being created in renewable energy to replace them.
For example, the US Bureau of Labor Statistics estimates that Solar PV Installer will be the 4th fastest-growing job type in ANY sector between now and 2030, with an estimated 52% growth rate over that period.
The median 2021 salary for a Solar PV Installer was $47,670 per year.
The solar market in the United States saw unprecedented growth in 2020, with 19.2 GWdc of solar capacity installed - a 43% increase over 2019.
Of this, 3,194 MWdc (MegaWatts defined conditions) was Residential PV installations (11% increase from 2019).
Solar accounted for 43% of all new electricity-generating capacity added in the US last year, making it the top technology for the second year in a row.
This growth is only set to continue, as solar becomes more and more cost-effective compared to other forms of energy generation.
Most jobs in the solar energy sector are related to installation and construction, to satisfy the rising industrial and consumer demand for new solar PV installations as detailed in the statistics above. The employment breakdown is as follows.
Installation jobs dropped by 4.2% to 154,610 during the COVID pandemic, but are expected to recover and continue to grow over the next few years.
The top two solar PV contractors in the United States in 2020 were AES Clean Energy and Silicon Ranch. They installed a combined total of 831.50 megawatts of capacity between them.
This number represents only the utility market. In 2020 there were over 610,000 installations in the smaller commercial and residential markets combined.
The solar industry will last, potentially, indefinitely - unless some better source of renewable energy is discovered in the future which makes solar power obsolete.
Even if we reached a theoretical point where every home and building in the world had solar panels, they still have a limited lifespan (currently around 30 years) after which point their performance begins to degrade.
Therefore the requirement to manufacture and install new PV, and to remove and recycle old ones, will continue to exist for the foreseeable future.
Under the IEA net-zero scenario, solar PV would need to contribute:
Yes, it is still possible that clean energy can power the world by 2050, and if we get there, solar will become the single largest source of electricity globally.
However, we would need to spend a lot more money to achieve this. The IEA net zero scenario estimates a worldwide investment of around $4 trillion by 2030 will be required.
As well as the obvious environmental benefit, this investment would stimulate economic growth and create new jobs for millions of people.
To appreciate the scale of what is required, the IEA estimates that the amount of solar PV we need to add is equivalent to the number of panels in the world’s largest solar park - every day.
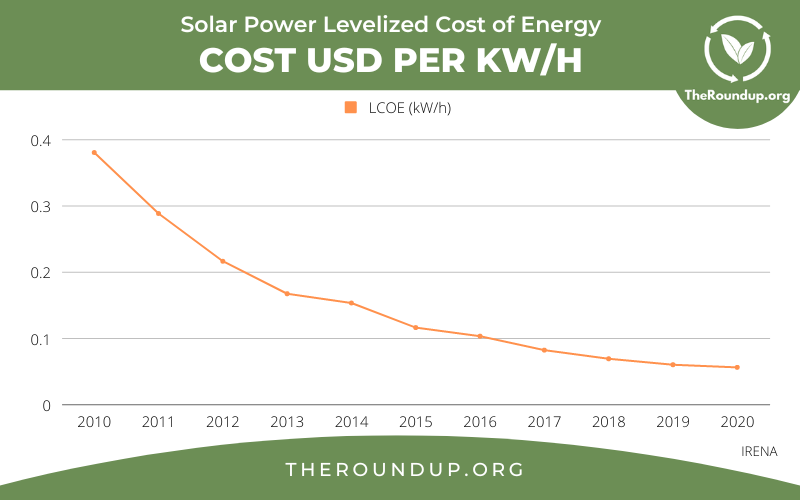
Yes, solar energy is now 7 times cheaper to produce than it was just 12 years ago.
The price of photovoltaic (PV) modules is a major factor in the cost of solar power. These are generally measured in cost per kWh (kilowatt hour).
The LCOE (Levelized Cost of Energy/Electricity) metric is a way to measure different sources of electricity generation, taking into account installation, operating and maintenance costs over a lifetime.
The IRENA database LCOE data clearly shows that the cost of solar is falling rapidly.
Those 2010 costs were estimated at $0.381 per kWh, and this had dropped to $0.057 per kWh by 2020, the most recent year for which data is available.
Recurring expenses include tracking systems to follow the sun, anti-reflective coating on panels, and electrical components to tie together PV arrays.
Yes, the outlook suggests that the 33% average annual growth in the solar industry that we have seen over the last 10 years is set to continue.
SEIA estimates that:
Solar power is becoming an increasingly popular option for home and business owners due to its many benefits. With solar panels, you can reduce your energy costs, help the environment, and even make money by selling excess power back to the grid.
In this article, we’ve listed some interesting solar power statistics that will give you a better idea of just how popular this renewable energy source is becoming. Keep in mind that as solar technology continues to improve and prices drop, these numbers are only going to continue to grow.
Are you considering making the switch to solar? If so, be sure to consult with a qualified installer who can help you choose the right system for your needs.
IRENA | IRENA | Energy.Gov | Energy.Gov | BLS.Gov | CBS News | EIA | EIA | IEA | IEA | Our World In Data | SEIA | Solar Power World | SEIA | IEA-PVPS | BP | Ember Climate | Nature.com | PVWatts | NREL | Terrawatts |