
TheRoundup is delighted to present the most comprehensive and up-to-date source of ebike statistics on the web.
If you are researching an article or paper about anything to do with electric bicycles, or are just curious to find out more, you will find the information you need here.
Our researchers reveal the latest 2024 data organized into several categories, including the global electric bike market, usage and consumer sentiment, environment and emissions, safety, and energy efficiency.
Contents
We begin by analyzing the size of the global electric bicycle market (Updated June 2024).
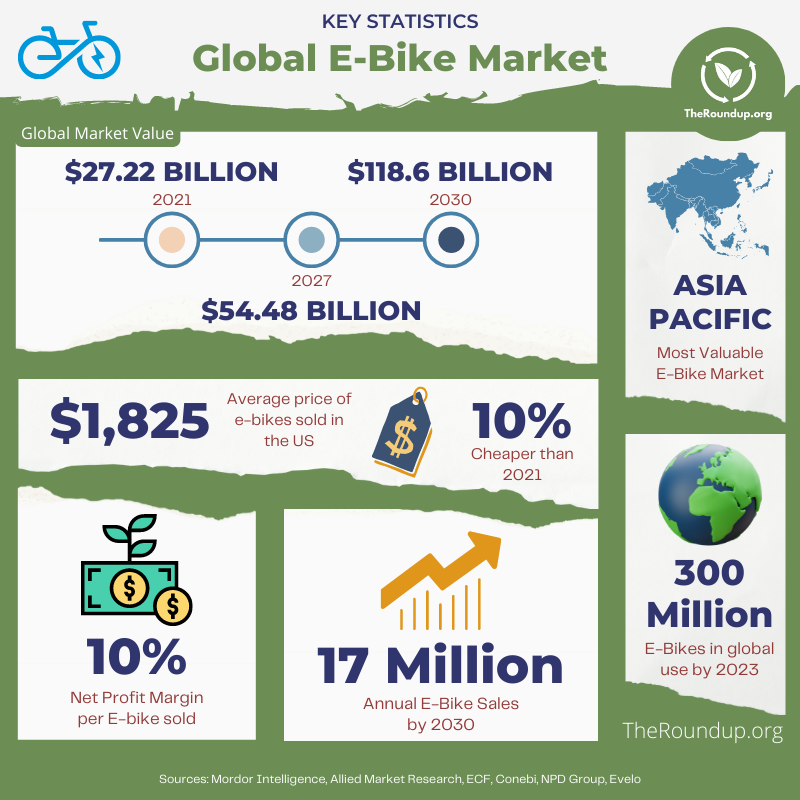
These statistics reveal the market's predicted growth, sales figures, which regions are most valuable, and which companies are most prominent.
(Mordor Intelligence / Allied Market Research)
The most lucrative electric bike market is in the Asia Pacific region.
However, the European market is the fastest growing, especially in countries where dedicated urban cycle lanes are being installed.
(Mordor Intelligence)
(ECF / Conebi)
Giant Bicycles, Trek Bikes, Jiangsu Xinri E-Vehicles, Tianjin Golden Wheel, Derby Cycle, BMW, and Yamaha are among the major players in the global electric bike market.
Rad Power Bikes and Trek Bikes are rated among the best eco-friendly electric bicycles by our independent reviewers.
Yes, as lithium-ion batteries, which power e-bikes, are getting more efficient, smaller, and cheaper, so the price of the bikes themselves is reducing.
Although the cost of high-end models is increasing, the fall in cost of cheaper bikes is bringing the average price down.
(NPD Group)
Making and selling e-bikes is profitable for manufacturers, but the markups are not as high as on some other physical goods.
Whilst production costs represent only around 42% of sales price, other costs mean that typically there is around a 10% net profit margin on each electric bicycle sold.
(Evelo)

The statistics show that e-bikes are becoming increasingly popular when compared to both the traditional bike market and other electric vehicles.
E-bikes are used by a broad demographic and can appeal to all age groups. Up until 2024, statistics show that most riders were aged between 40 and 70 years.
(TREC)
In addition to the electric bicycle market statistics above, when trying to gauge electric bike usage, we also need to consider data from cycle sharing schemes.
All of the available statistics point toward the fact that most users will choose e-bikes over traditional pedal cycles wherever a choice is available.
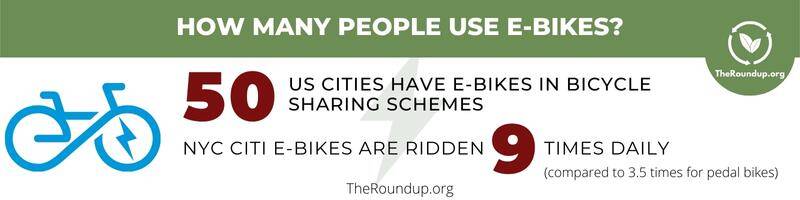
(Citi Bike / BCyle / Hellobike)

A number of consumer surveys have been carried out to establish the various reasons why people ride e-bikes, and how satisfied they are with the experience.
Perhaps unsurprisingly given the size of its population, China is the country where e-bikes are most frequently used.
Aside from China, Germans ride electric bicycles most often. Spain, Denmark, France, and Italy are the next most frequent users, reflecting the relative strength of the European market.
(INSG)
Many e-bike riders say that they want to reduce car usage and help the environment.
But are e-bikes actually better for the environment, and if so, to what extent do they help?
The statistics actually show a substantial environmental benefit of electric bicycles as compared to other motorized forms of transport.
E-bikes are potentially far better for the environment than driving a car, and case studies have shown the positive impact of replacing short car trips with electric cargo bikes in urban areas.
But there are still potential environmental downsides.
The electricity needed to run an electric bicycle has to be generated, so much depends on where the power comes from.
If the power is generated from fossil fuels rather than renewables, then e-bikes still have a substantial carbon footprint. If it comes from renewables then the footprint is as close to zero as is currently possible.
A lithium-ion battery-powered electric bicycle is better for the environment than one that runs on older lead acid batteries. The older batteries are larger, heavier, don't last as long, and may leach lead into the ground if not correctly disposed of.
Yes - in a study based in Portland, Oregon it was found that e-bikes do significantly reduce CO2 emissions compared to cars.
It found that if 15% of daily trips in the city were taken using e-bikes instead of cars, it would achieve an 11% reduction in carbon emissions, amounting to around 900 metric tons per day.
(McQueen et al)
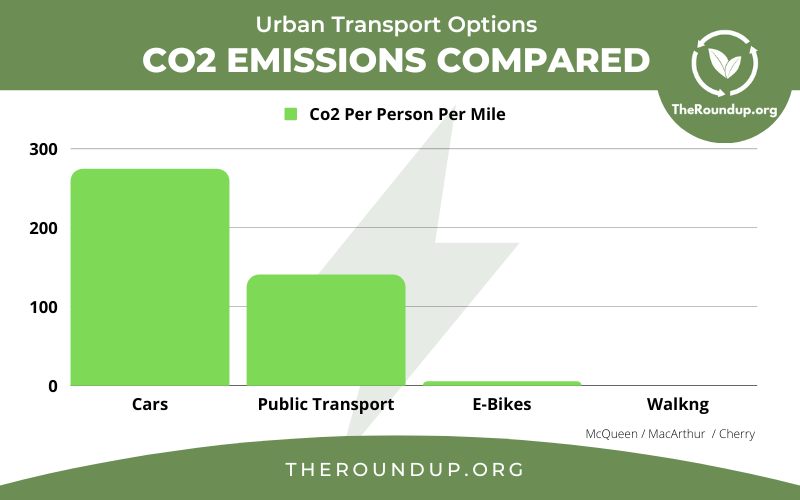
In the Portland study, it was found that e-bikes emit 4.9g of CO2 per person mile, taking into account the carbon cost of the electricity generated in the region.
This compares extremely favorably with the 140g of CO2 per person mile from public transport, and a massive 274g emitted by cars.
(McQueen et al)
There are far more accidents involving cars than involving e-bikes, but that's because there are far more cars on the road.
At this time it is impossible to say which is safer as there are too many variables in play. However, as e-bike usage increases, so does the number of accidents involving them.
(NHTSA / CPSC)
The statistics show that as a rule, e-bikes are broadly the same as regular bikes in terms of safety, when you account for the fact that e-bikes can (and generally do) go faster.
(TREC / Langford et al / Biomed Central)
Because e-bikes contain batteries that store a large amount of energy, they can on rare occasions catch fire if they are not properly charged or stored.
Fires can happen with any device that is powered by a lithium-ion battery, so it is not a problem exclusive to the electric bike industry.
But the size of the battery needed to power the double electric motor in an e-bike means that any fire can potentially be more severe.
The maximum speed of an e-bike is 28mph, which means that, if you could travel at top speed for the entire journey, it would take just over 21 minutes to travel 10 miles.
This might be possible in a rural environment with no hills or obstacles, but in an urban environment, you would need to factor in traffic congestion, road signals, and pedestrians, meaning that the journey would almost certainly take a lot longer.
Studies have shown that on average, e-bike journeys are 21% faster than the equivalent journey on a pedal bike. (BioMed Central)
Professional cyclists can go faster than 40mph, but that is unlikely to be achievable for beginner or even intermediate riders.
You would also need to consider factors such as the terrain, weather, other traffic, type of bike, age, and fitness level of the cyclist.
Most intermediate cyclists will achieve an average speed of around 15mph, which means that electric bikes, which can reach up to 28mph, are potentially a lot faster than pedal bikes.
(Google Patents / Yamaha Cycles / UPS / US Dept of Interior / TRIP Journal)
The e-bike market has enjoyed substantial growth already and will continue to do so. E-bike sales are increasing globally, although uptake has been quicker in some regions than others.
Consumers are attracted to electric bicycles for a variety of reasons, with a desire to reduce car journeys and help the environment being particularly strong drivers.
Electric bikes are an efficient, clean, and eco-friendly transportation method that is particularly beneficial in urban environments. They do not have a zero carbon footprint, but it is lower than that of any other motorized transport solution.
There are some concerns surrounding safety, which could be improved by better urban planning and greater awareness among both riders and other road users. There have also been incidents of fires involving e-bike batteries, which indicates that better education regarding the correct way to charge and store these is needed.
Overall, it seems that e-bikes are here to stay, and are likely to become an increasing presence in our towns and cities over the years to come.
If you would like to use an infographic from this article, they are licensed under Creative Commons CC BY which means they can be used or distributed as long as they are accompanied by an attribution link back to this page.
AMR https://www.alliedmarketresearch.com/electric-bikes-market
BioMed Central https://pssjournal.biomedcentral.com/articles/10.1186/s13037-022-00318-9
Citi Bike NYC https://www.citibikenyc.com/how-it-works/electric
Conebi https://www.conebi.eu/industry-market-reports/
ECF https://www.ecf.com/resources/library
Efficiency Vermont https://www.efficiencyvermont.com/news-blog/whitepapers/electric-bikes-survey-and-energy-efficiency-analysis
INSG http://insg.org/wp-content/uploads/2019/01/INSG_Insight_23_Global_Ebike_Market.pdf
Langford BC, Chen J, Cherry C (2015) Risky riding: Naturalistic methods comparing safety behavior from conventional bicycle riders and electric bike riders
Madison BCycle https://madison.bcycle.com/
McQueen M, MacArthur J, Cherry C (2019) The E-Bike Potential: Estimating the Effect of E-bikes On Person Miles Travelled and Greenhouse Gas Emissions
Mordor https://www.mordorintelligence.com/industry-reports/e-bike-market
NHTSA https://cdan.nhtsa.gov/query
Pew Research https://www.pewresearch.org/
Science Direct https://www.sciencedirect.com/science/article/pii/S1361920922000050#s0125
Transportation Research & Education Center https://trec.pdx.edu/
TRIP https://www.sciencedirect.com/science/article/pii/S259019821930017X
Zhang SP, Tak TO (2021) Efficiency Evaluation of Electric Bicycle Power Transmission Systems