
Plastic waste and pollution have come to the forefront of public attention in recent years, but it's only when you see the statistics that you realize the sheer scale and complexity of the problem.
We have researched and gathered the latest key plastics industry data in five main areas: plastic waste generation, plastic production, recycling, pollution, and future outlook.
You'll learn how much plastic is already out there, how much more is being produced each year, and what it's used for. Also, how much gets recycled, how much goes to waste, and what happens to it.
By the time you finish reading this article, you'll have the data to decide for yourself how important this issue is, and how much you're prepared to change in order to help fix it.
Contents
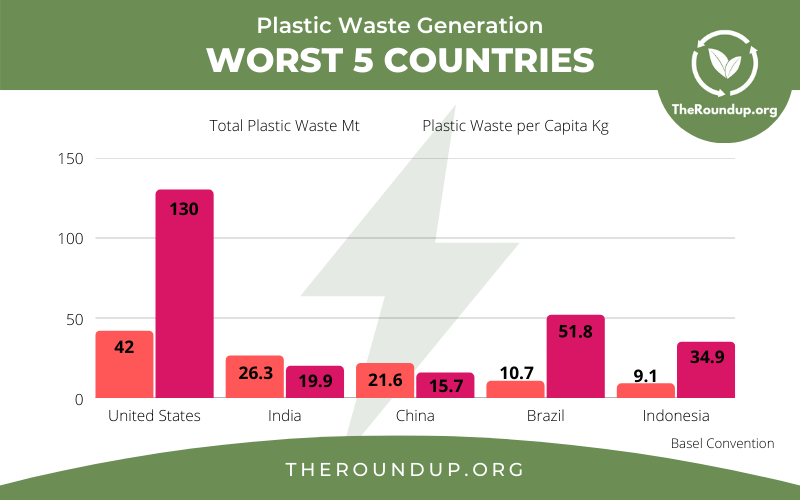
An attempt to quantify the sheer volume of plastic waste created globally was made in 2016. The United States, India, and China hold the unwanted top 3 positions in the global plastic waste league table.
Sadly, the USA is by far the worst offender, producing a horrifying 42 million metric tons of plastic waste per year. India was second worst with 26.3 million, and China third with 21.6 million.
However, other studies, including the UN Basel Convention, rate China as the largest producer of plastic waste in the world overall, although the US remains the worst per capita.
Brazil, Indonesia, Russia, Germany, and the United Kingdom all feature in the top ten.
The choices we make as individuals can make a huge difference. Wherever you live, a few simple changes to your daily lifestyle can help reduce this shocking volume of pollution.
The USA produces the most Municipal Solid Waste (trash or garbage) per head of population of any country in the world.
According to EPA, the United States generated 130Kg of plastic waste per head of population in 2018.
The one positive observation is that the annual rate of increase had slowed over the previous three years, after seeing dramatic increases in the decades prior. The test now is whether the country can begin to reduce its waste rather than simply slowing its increase.
Asia and Western Europe throw away the highest percentage of plastic in Municipal Solid Waste (trash or garbage). In both these regions, 12% of MSW is plastics, which often end up in landfills or the oceans.
Other regions such as Latin America (11%), the Middle East (10%), Japan (9%) and Central Europe (9%) are not far behind.
A staggering 46% of plastic waste comes from packaging.
This comprises everyday items including containers such as bottles, pots, tubs and trays, or wrappings such as plastic shopping bags, rubbish bags, bubble wrap or shrink wrap.
These are the areas in which our choices as individuals can have a massive effect. By choosing eco-friendly, non-plastic alternatives, we can all help to reduce this crippling amount of waste.
Break Free From Plastic conducted a global plastic waste audit to find out which companies’ products made the biggest contribution to the problem.
The results showed that Coca Cola products were found most frequently, with 13,834 items found across 51 countries. Next came Nestle products, with 8,633 items.
Colgate-Palmolive, Unliever and Pepsico all appear in the top ten, with each company making significant waste contributions of between 5000-6000 items.
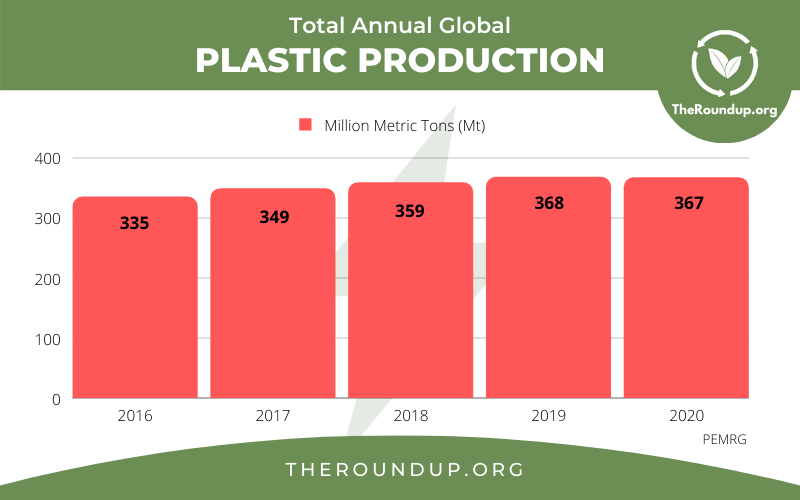
The sheer scale of global plastic production is staggering. Production grew exponentially in the second half of the 20th century. In 1950, just 1.5 million metric tons of plastic were produced worldwide, but this had grown to 200 million by 2002.
Production continues to grow steadily year on year. By 2019 we were producing a massive 368 million metric tons.
The rate of increase stalled in 2020, largely due to reduced demand caused by the COVID pandemic. It is predicted that production will continue to increase year on year when the latest data for 2021 becomes available.
Aside from the more obvious environmental impact of plastic waste, plastic production is also energy intensive/
Producing plastic takes around 62 to 108 megajoules of energy per kilogram based on U.S. efficiency averages.
A study suggested that between 2.5% and 3.6% of global oil and natural gas consumption was used as feedstock for plastics
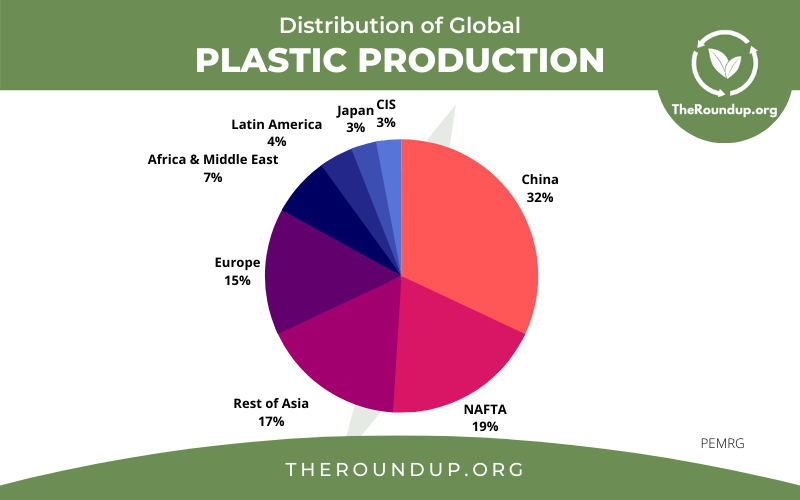
In terms of production and distribution of plastic products, China leads the way with a 32% share of global production volume. It is followed by NAFTA with 19%. The rest of Asia combined is responsible for 17%, and Europe produces 15%.
It’s big business. Very big. As the world’s largest plastic producer and exporter, China’s plastic exports were reportedly worth 48.31 billion U.S. dollars in 2019, an increase of some $5 billion on the previous year. This figure has more than trebled since 2009.
So what exactly is all that plastic being used for? The main application is packaging, which used 115 million metric tonnes in 2017. This is almost twice as much as the second most common application, building and construction, which used 64 million. Transport was third, using 47.5 million tonnes.
By working to reduce our usage of plastic packaging, we could therefore, in theory, make a major dent in overall annual global plastic production.
The Coca-Cola company has the largest plastic footprint on earth, using an eye watering 2.9 million metric tonnes of plastic packaging annually.
PepsiCo (2.3 million) and Nestle (1.7 million) make up the rest of the top 3, while Danone (820,000), Proctor & Gamble (714,000) and Unilever (700,000) are also major contributors.
So that’s something to think about next time you’re thirsty and fancy a soft drink. Are you comfortable with buying from companies that make such significant contributions to the plastic pollution crisis?
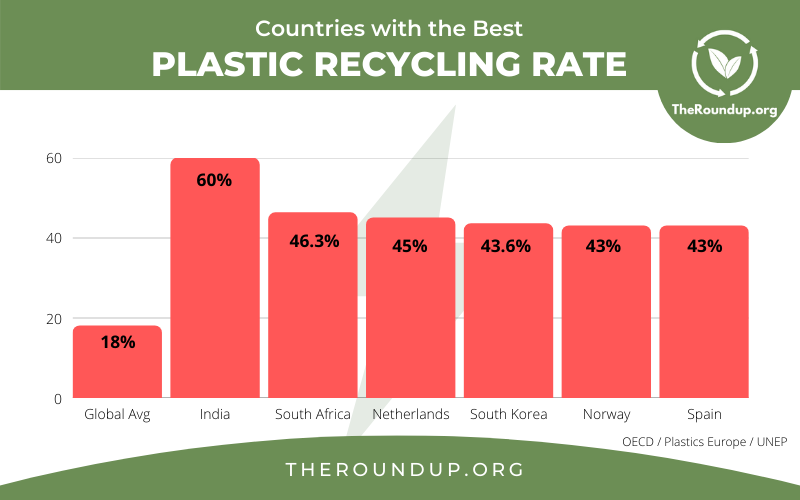
India has the best plastic recycling rate in the world, reportedly recycling as much as 60% of its plastic waste.
South Africa, the Netherlands, South Korea, Norway, and Spain come next on the list.
South Korea aims to increase its rate to 70% by the year 2030.
The global average plastic recycling rate is just 18%.
Since 1950, when plastics began to be mass-produced, the world has manufactured over 9 billion metric tonnes of plastic.
Of this, just 600 million tonnes (a little over 6.5%) has been recycled, and just 200 million tonnes of that is still in use.
More than half the plastic ever produced (5 billion tonnes) has gone to waste.
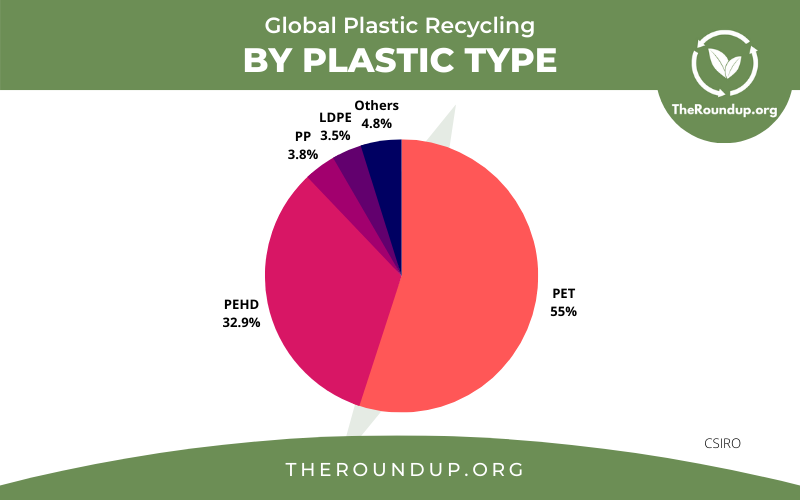
PET (Polyethylene Terephthalate) is the most commonly recycled type of plastic, accounting for 55% of global plastic recycling.
High-Density Polyethylene (HDPE) accounts for another 32.9%.
Other types of plastic are rarely recycled.
See also: What do the 7 Plastic Recycling Symbols Mean?
The main use of recycled plastics is in packaging.
Around 41% is used in non-food packaging, and a further 28% is used in food contact packaging.
The construction and automotive industries account for most of the remaining usage.
When it comes to PET plastic bottle recycling rates, Norway is the world leader. After implementing a deposit return scheme, they now recycle 97% of PET plastic bottles sold.
Other nations with high recycling rates are Japan (84.8%), Sweden (84%) and India (80%).
The European Union lags behind at 58.2% and the USA recycles just 28.9%. But surveys suggest there is public support for a similar Norway style scheme in other countries. If both the EU and US could do as good a job as Norway, we would see far fewer bottles floating in our oceans.
Many developed countries have opted to send their garbage elsewhere when they are unable or unwilling to deal with it themselves.
The United States, Japan, Germany, United Kingdom, and Belgium are named as the Top 5 exporters of plastic waste in the world.
The US comes top, contributing 16.2% of the total volume of plastic waste exported. Japan contributes 15.3%, and Germany 12.7%.
In the past, China was the chief global importer of plastic waste. However, legislation changes there mean that this is no longer the case, and developed countries have had to find other destinations to offload their trash.
Malaysia, Thailand, Vietnam and Hong Kong are now the top plastic waste importers. Perhaps surprisingly, the USA itself also appears in 5th place on the importers list.
However, with governments in both Thailand and Malaysia announcing bans on plastic scrap imports in recent years, it is likely that plastic waste export will become more difficult and that industrialized nations will need to find ways of dealing with their own problems in future.
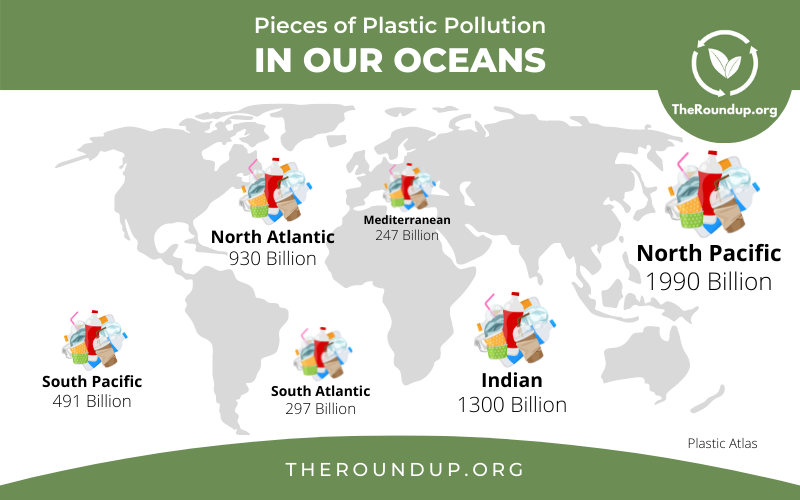
The sheer scale of plastic waste in our Oceans is staggering.
The worst affected region is the North Pacific, where it is estimated that nearly two trillion pieces of plastic are present.
The so-called “Great Pacific Garbage Patch”, floating off the coast of California, is more than 4 times the size of Germany.
There are an estimated 1.3 trillion pieces in the Indian Ocean, 930 billion in the North Atlantic, and another 491 billion in the South Pacific.
Contrary to popular belief, only a small proportion of plastic waste floats. The vast majority either sinks or is washed ashore.
The 2019 International Coastal Ocean Cleanup analyzed the nature of the debris and waste items that had washed up on the world’s coastlines and riverbanks.
It was found that plastic food wrappers (nearly 5 million collected) and cigarette butts (4.2 million collected) were the most commonly found items.
The next most common were plastic bottles and bottle caps.
Plastic straws, stirrers, cups, plates, and bags were just some of the other items that were found in abundance.
If the impact on our beaches and marine life doesn’t persuade you that plastic pollution is a catastrophe, then how about this?
The sheer volume of plastic in our rivers and oceans will inevitably lead back to our drinking water. A study by Orb Media found that plastic fibers were present in 83% of tap water samples worldwide.
When the data was broken down by country, it repealed that residents of the USA and Lebanon were most likely to find plastic in their tap water, with 94% of samples testing positive in each country.
Samples in India were 82% contaminated, whereas Europe had 72%.
Something to think about next time you throw a plastic bottle, bag, carton, or wrapper away, there’s a good chance you’ll be drinking part of it (or a similar one) within the next few years.
The total cumulative volume of plastic waste was estimated to be 6.3 billion metric tonnes in 2015. Forecasts project that this could almost double to 12 billion by 2050.
Unless we significantly reduce production and increase recycling, the world will have a huge, possibly unsolvable problem.
Increased awareness about the plastic pollution problem is still not expected to reduce our consumption.
Global demand for plastic is projected to increase by 4.1% by 2030, and again by a further 2.4% between 2030 and 2050.
There are at least some signs of increased demand for eco-friendly water bottles and other sustainable alternatives.
The reusable water bottle market, for example, is expected to grow in value from $8.75 billion in 2020 to $10.6 billion in 2025.
The value of the global plastic recycling industry is projected to grow from $34 billion in 2019 to $60 billion in 2027.
This represents a 6.8% compound annual growth rate.
Recycling offers the only serious and effective method of reducing the existing and future burden of plastic pollution on our planet, so any growth and innovation in this sector can only be positive news for us all.
PlasticsEurope (PEMRG) | Stanford University | China Statistical Yearbook | Danmarks Tekniske Universitet; UNEP | Statista | AAAS | Basel Convention | EPA | UNEP | Break Free From Plastic | Heinrich-Böll-Stiftung | CSIRO | Heinrich-Böll-Stiftung | Plastic Atlas | Ocean Conservancy | Orb Media | News.com AU | IHS Markit | Grand View Research | Transparency Market Research | The Hindu | Plastics SA